Forex Backtesting Calculator
Forex Backtesting Calculator
.markdown
Unlock Your Trading Potential with a Forex Backtesting Calculator
If you’re serious about forex trading, testing your strategy before risking real money is a must. A tool designed for historical strategy analysis can be a game-changer, giving you a clear view of how your trades might have played out over time. Imagine having detailed metrics at your fingertips—returns, risk levels, and more—without spending hours on manual calculations.
Why Backtesting Matters for Forex Traders
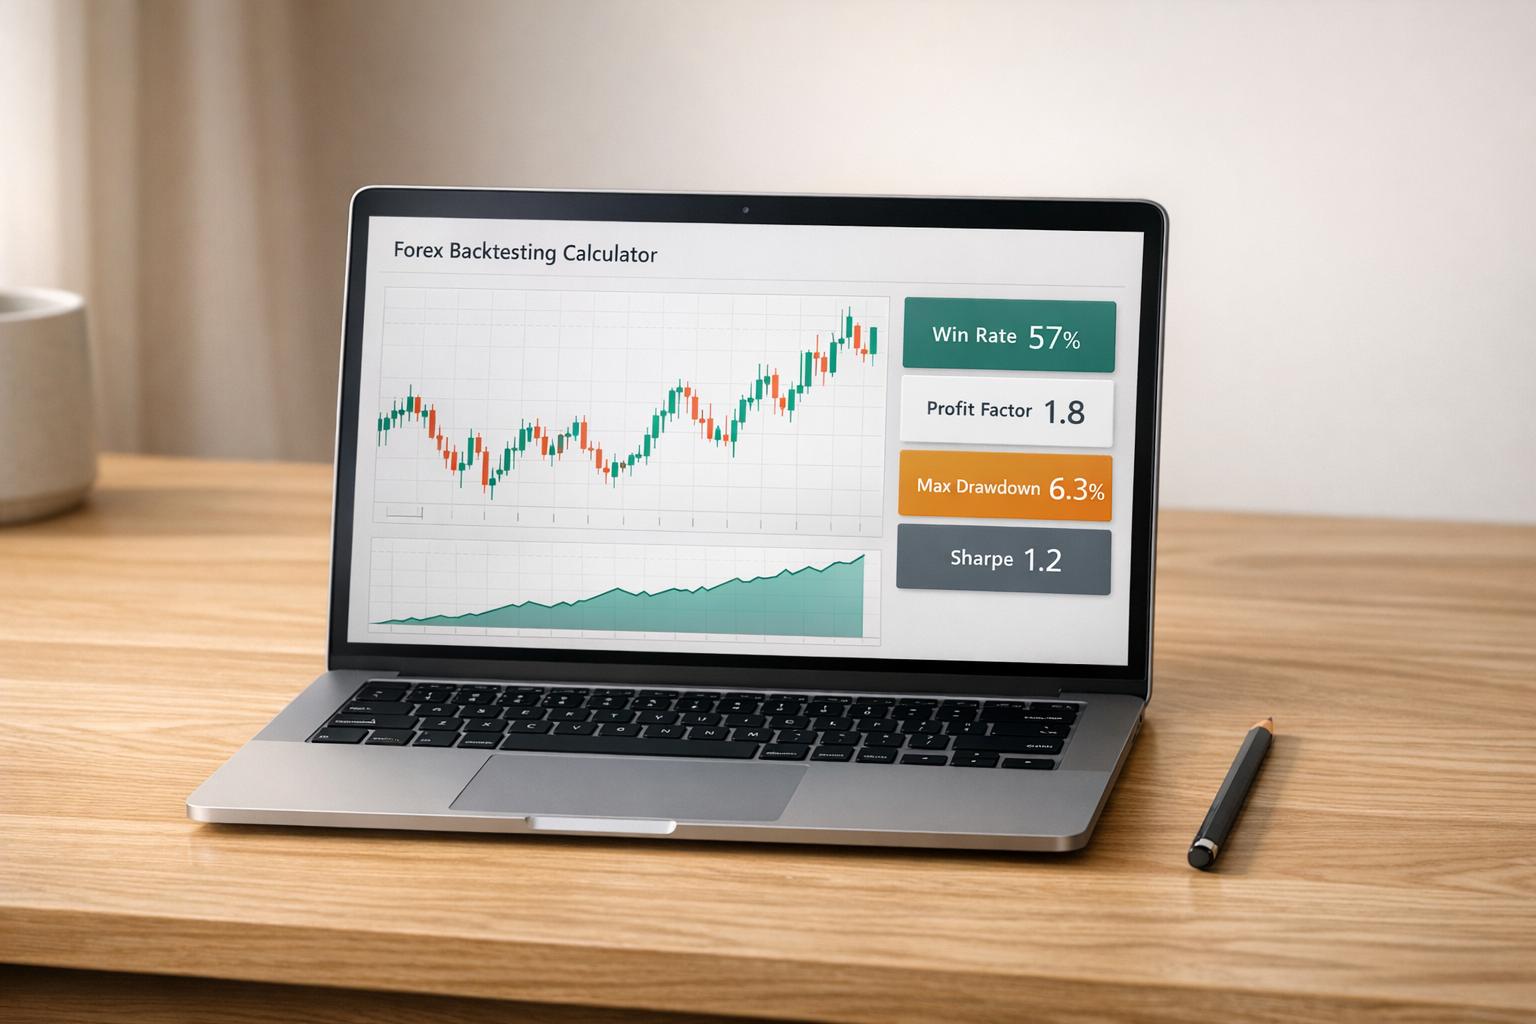
Every trader knows the market is unpredictable, but past performance can offer valuable clues. By simulating trades with historical data, you uncover patterns and pitfalls in your approach. Maybe your win rate looks solid, but a high drawdown signals trouble during losing streaks. Tools that analyze trading history help you refine your plan, cut risks, and boost confidence. Whether you’re tweaking a scalping method or testing a long-term trend system, this kind of insight is priceless.
Make Data-Driven Decisions
Gone are the days of guesswork. With the right resources, you can measure key stats like ROI and Sharpe ratio, ensuring your strategy aligns with your goals. Take control of your trading journey today by diving into data that matters.
FAQs
Why should I backtest my forex trading strategy?
Backtesting is like a dress rehearsal for your trading plan. It lets you see how your strategy would’ve performed in the past using real historical data. Without risking a dime, you can spot weaknesses—like high drawdowns or inconsistent returns—and make adjustments. Plus, it builds confidence in your approach before you trade live. Our calculator simplifies this by doing the heavy math for you, so you can focus on refining your edge.
What metrics does this calculator provide, and why do they matter?
You’ll get a breakdown of total profit/loss, ROI, maximum drawdown, Sharpe ratio, and win/loss ratio. Each tells a piece of the story: ROI shows your overall return on investment, drawdown highlights the biggest dip in your account (a risk indicator), and Sharpe ratio measures return versus risk. Together, they paint a full picture of your strategy’s strengths and vulnerabilities, helping you decide if it’s worth pursuing.
Does the tool account for trading costs like spreads?
Absolutely, we’ve got you covered. Spread costs can eat into profits more than many traders realize, especially with frequent trades. Our calculator factors these in when you input your data, ensuring the results reflect a realistic outcome. Just make sure to include accurate spread values for each trade or use an average if you’re estimating. This way, you’re not caught off guard by hidden costs when trading for real.