Correlation Matrix in MQL5: Basics

Correlation Matrix in MQL5: Basics
A correlation matrix in MQL5 helps traders understand how financial assets move relative to each other. It calculates correlation coefficients, ranging from -1 (inverse relationship) to +1 (perfect correlation), and presents them in a matrix format. Traders use this tool to:
- Diversify portfolios by identifying weakly correlated assets.
- Confirm trends when correlated assets show similar behavior.
- Hedge positions using negatively correlated instruments.
MQL5 simplifies this process with built-in functions like MathCorrelationPearson and matrix::CorrCoef. These functions allow traders to compute correlations efficiently, even for multiple instruments, and visualize results with heatmaps or tables. Proper data preparation, like aligning datasets and converting prices to returns, is crucial for accuracy.
For example, in May 2025, a study revealed a strong positive correlation (0.87) between AUDUSD and NZDUSD, while EURUSD and USDCHF showed a strong negative correlation (-0.80). Such insights can guide trading strategies, reduce risks, and identify opportunities like statistical arbitrage.
Automation tools like Traidies can further streamline correlation analysis, enabling real-time monitoring and strategy implementation with minimal manual effort.
MQL5 Coding Tutorial - Correlation Indicator for Signals
sbb-itb-3b27815
Preparing Data for Correlation Analysis in MQL5
Start by gathering and organizing price data for all the symbols you want to analyze. Use the CopyClose function to retrieve closing prices or CopyRates if you need full bar details.
Setting Up Data Arrays for Financial Symbols
To begin, create a string array to hold the names of your target symbols. Use CopyClose to pull historical closing prices for each symbol. If a symbol isn’t already on your chart, activate it with SymbolSelect(symbol, true).
For efficient calculations, take advantage of MQL5's matrix and vector types. A matrix allows you to store data for multiple symbols in one structure, with rows or columns representing different instruments. This setup works seamlessly with the matrix::CorrCoef() method, which can calculate an entire correlation matrix in a single step - eliminating the need for nested loops.
Before performing the analysis, convert raw prices into returns using the formula (price[k] - price[k-1]) / price[k-1]. This step is critical because it shifts the focus to relative price changes rather than absolute values, leading to more meaningful correlation results. Always verify data availability with Bars() and ensure that Copy functions return valid data (i.e., not -1).
Once your data arrays are prepared and returns are calculated, you’re ready to compute correlation coefficients in MQL5.
Ensuring Data Accuracy and Consistency
To avoid errors caused by mismatched datasets, align all data arrays by resizing them to the smallest common bar count. Use the MathMin() function to determine the minimum size based on CopyClose results.
Check for invalid values like NaN or Infinity using MathIsValidNumber(). Also, confirm that your dataset has nonzero variance to prevent division-by-zero errors during calculations. For basic correlation analysis, a minimum of 20 bars is recommended, but larger datasets - around 200 to 300 values - offer greater reliability for statistical testing and validation.
Calculating Correlation Coefficients in MQL5
Understanding Correlation Coefficients: Values, Meanings, and Trading Applications
Once your data arrays are ready, you can compute correlations directly using MQL5's built-in functions.
Using MathCorrelationPearson in MQL5
MQL5 includes the MathCorrelationPearson function, which calculates the Pearson correlation coefficient. This coefficient measures the strength and direction of a linear relationship between two datasets. To use it, first include the statistics library in your code by adding #include <Math\Stat\Math.mqh> at the top.
The function takes two input arrays - typically returns data from two symbols - and calculates the Pearson coefficient, storing the result in a specified variable. It also returns a boolean to indicate whether the calculation was successful. For accurate results, ensure both arrays are the same size and free from invalid data.
If you need to analyze multiple symbols simultaneously, the matrix::CorrCoef() method is a better option. This function computes a full correlation matrix in one call, making it more efficient than looping through pairs manually. To use it, structure your returns data in a matrix format, where each row or column represents a different instrument. Then, call CorrCoef() to calculate all pairwise correlations at once. Once computed, these coefficients can help you understand the relationships between assets.
Interpreting Correlation Results
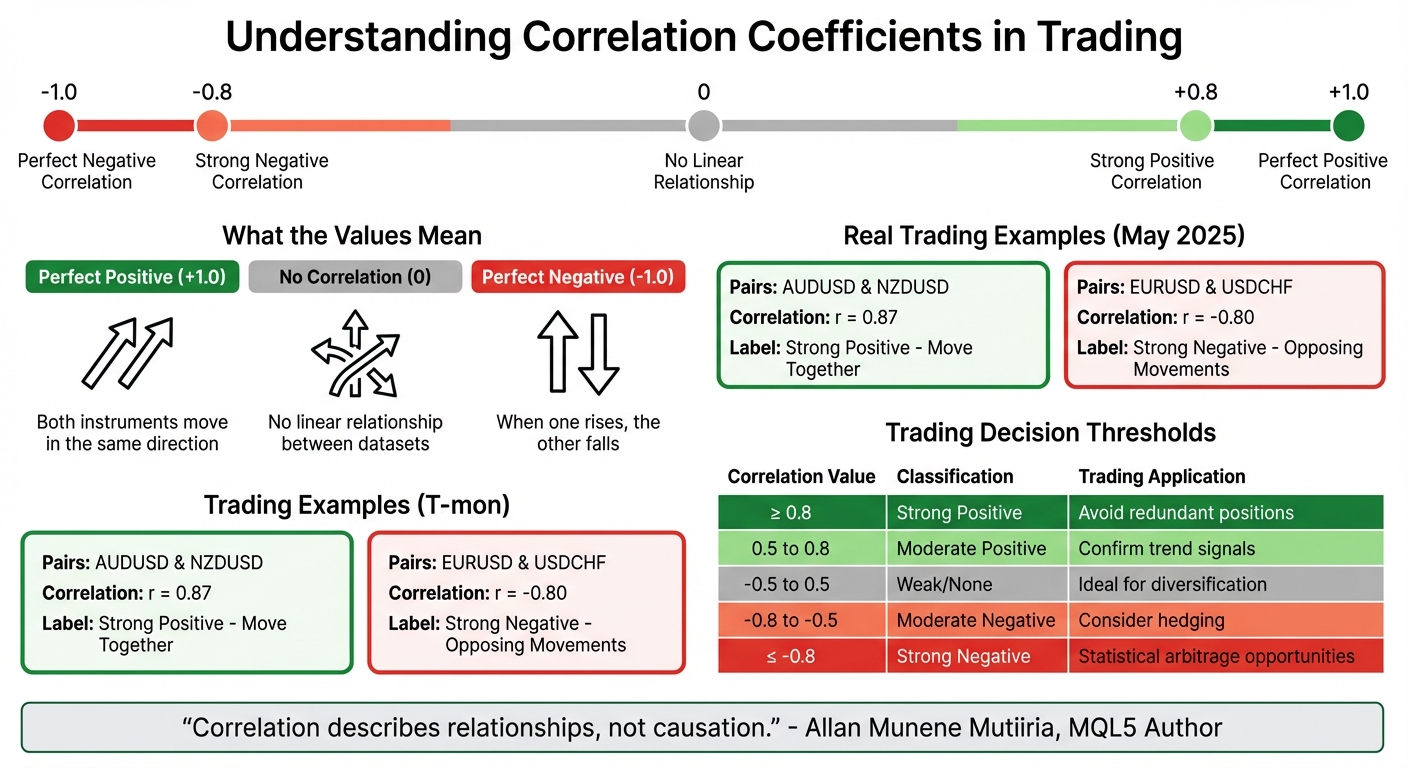
Correlation coefficients range from -1.0 to +1.0. Here's what the values mean:
- +1.0: Perfect positive correlation - both instruments move in the same direction.
- -1.0: Perfect negative correlation - when one rises, the other falls.
- 0: No linear relationship between the two datasets.
In May 2025, developer Allan Munene Mutiiria conducted an analysis using an MQL5 dashboard on 30-minute (M30) charts. The results showed a strong positive correlation (r = 0.87) between AUDUSD and NZDUSD, indicating they moved together during the period of May 6 to May 7, 2025. Conversely, EURUSD and USDCHF displayed a strong negative correlation (r = -0.80), reflecting their opposing movements.
For trading decisions, the following thresholds are helpful:
- Correlations of ≥ 0.8 are considered "strong positive."
- Correlations of ≤ -0.8 are "strong negative."
- Correlations with an absolute value of < 0.5 suggest weak or no relationship.
Assets with low correlations are ideal for portfolio diversification, as their independent movements can help reduce overall volatility.
"Correlation describes relationships, not causation." - Allan Munene Mutiiria, MQL5 Author
Keep in mind that Pearson correlation only measures linear relationships. If you suspect non-linear dependencies, explore rank-based methods like Spearman or Kendall. These methods assess monotonic relationships, regardless of the specific price changes.
Building and Displaying a Correlation Matrix in MQL5
Once you've calculated the correlation coefficients, the next step is to organize and display this data effectively.
Creating a Correlation Matrix Table
To structure your correlation data, use a two-dimensional array. For instance, you can define it as double correlation_matrix[MAX_SYMBOLS][MAX_SYMBOLS][2]. This setup maps each pair of symbols to a specific cell in the table.
Start by parsing a list of symbols, like "EURUSD,GBPUSD,USDJPY", using StringSplit(). These symbols will form both the rows and columns of your matrix. For each pair of symbols, retrieve their price data, compute returns, and calculate correlation coefficients using either MathCorrelationPearson() or matrix::CorrCoef().
To avoid errors from mismatched data lengths, use MathMin() to ensure uniform array sizes when working with CopyClose() results. This step is essential for maintaining consistency during calculations.
Visualizing the Correlation Matrix
Displaying the matrix in a way that's easy to interpret is key. Use nested loops to create an object-based grid, employing OBJ_RECTANGLE_LABEL for the background and OBJ_LABEL for the correlation values.
For a more intuitive display, implement a heatmap. Use conditional logic to assign colors to cells based on their correlation values:
- Green for
r > 0.8 - Light green for
r > 0.5 - Red for
r < -0.5
Apply these colors dynamically using ObjectSetInteger and the OBJPROP_BGCOLOR property.
"In standard mode, the dashboard uses predefined thresholds to categorize correlations, applying distinct colors for strong positives or negatives" - Allan Munene Mutiiria, MQL5 Author
If you're working with a large number of symbols, the CCanvas library can be a great tool. It allows you to render anti-aliased graphics and smooth gradients efficiently. To optimize performance, use ChartRedraw() sparingly - call it only after all graphical objects have been updated, rather than after each individual change.
Using Correlation Matrices to Identify Co-Movement Patterns
Detecting Highly Correlated Instruments
After constructing your correlation matrix, the next step is to pinpoint instruments that exhibit strong co-movement. A common approach is to use thresholds like r ≥ 0.80 for strong positive correlations and r ≤ -0.80 for strong negative correlations.
For instance, currency pairs like GBPUSD and EURUSD often show a strong positive correlation because both share the USD as their quote currency. On the other hand, GBPUSD and USDCAD frequently display an inverse relationship, as the USD acts as the quote currency in one pair and the base currency in the other.
To ensure the accuracy of these correlations, validate them using p-values. Significance markers, such as *** for p < 0.01, can help confirm the reliability of the data. Another critical factor is monitoring how long a correlation remains consistent. For example, a coefficient above 0.75 maintained over three to four candlesticks signals a more dependable trend.
These insights are essential for integrating correlation data into effective trading strategies.
Incorporating Correlation Analysis into Trading Strategies
The correlation matrix can directly enhance your trading strategy by refining both risk management and trade execution. When highly correlated pairs (r ≥ 0.8) are identified, you can treat them as a single entity to avoid overexposure. For example, opening positions in both pairs could unintentionally double your risk without adding diversification. Similarly, taking opposite positions on correlated pairs might lead to redundant hedging costs.
For pairs with strong negative correlations (≤ -0.80), opportunities arise for strategies like statistical arbitrage or inter-market spread trading. Correlation analysis can also strengthen trade signals. For example, a long position on EURUSD becomes more compelling if its positively correlated counterpart, GBPUSD, is also showing bullish momentum.
Automating these processes can make monitoring easier. For instance, by setting an AlertThreshold (e.g., 0.8) in your MQL5 code, you can receive notifications whenever significant co-movement levels are detected.
Using Traidies for Automated Implementation

Tracking multiple correlations manually is a daunting task, which is where automation tools come in. Platforms like Traidies (https://traidies.com) simplify this by converting natural language inputs into MQL5 code.
For example, you could describe a strategy like: "Buy EURUSD when its correlation with GBPUSD exceeds 0.8 and both show upward momentum." Traidies' AI-driven tools can automatically generate the necessary MQL5 code to gather data, calculate correlations, and execute trades based on your specified thresholds. The platform also offers automated backtesting with historical data, allowing you to test and refine your correlation-based strategies before going live.
Conclusion
The journey from data preparation to visualization highlights how correlation matrices can support traders in making informed decisions. These matrices serve as a powerful tool to understand the relationships between financial instruments. By using MQL5's built-in functions like matrix::CorrCoef and MathCorrelationPearson, you can calculate these relationships and apply p-value statistical significance testing to ensure your results are reliable and not just random noise.
Defining clear thresholds is crucial for managing overexposure and identifying hedging opportunities. Strong positive correlations can help you avoid redundant positions in assets that move together, while strong negative correlations might uncover chances for statistical arbitrage.
It's also important to go beyond Pearson's linear correlation. Methods like Spearman or Kendall, which focus on non-linear and rank-based relationships, can provide additional insights into complex market behavior.
Automating your analysis with tools like Traidies makes it easier to monitor correlations in real time. You can set up MQL5 alerts to notify you when correlation coefficients hit specific thresholds, or create visual dashboards with heatmaps for quick pattern identification. Traidies simplifies this process by converting your strategy ideas into functional MQL5 code and running automated backtests with historical data.
Continuous monitoring is essential as market conditions evolve. By combining solid data preparation, statistical validation, and automation, you can turn correlation analysis into a practical tool that enhances your trading strategies.
FAQs
What timeframe and bar count should I use for reliable correlations?
When performing correlation analysis in MQL5, it's important to choose a timeframe and bar count that reflect stable market relationships. Longer timeframes like daily or weekly charts, combined with at least 100–200 bars (roughly 3–6 months on a daily chart), are generally a solid starting point. Using shorter timeframes or fewer bars can result in less reliable outcomes, so make adjustments based on your specific analysis objectives and the current market environment.
Should I calculate correlation on prices or returns in MQL5?
To analyze relationships between assets in MQL5, it's best to calculate correlation using returns. This approach focuses on percentage changes rather than absolute prices, helping to reduce the influence of differing price scales between assets.
How can I keep my correlation matrix fast with many symbols?
When dealing with a correlation matrix in MQL5 that includes numerous symbols, keeping it fast and efficient boils down to smart data management and calculation techniques. Here are a few ways to optimize:
- Limit the symbols processed simultaneously: Handling fewer symbols at a time reduces the computational load, making the process faster and smoother.
- Update incrementally: Instead of recalculating the entire matrix, focus on updating only the parts that have changed. This saves both time and resources.
- Adjust update frequency: Reducing how often the matrix is updated can significantly improve performance without sacrificing accuracy for most use cases.
- Leverage MQL5's built-in functions: Use tools like
CorrCoeforCorrelate, which are designed for efficient calculations, to speed things up.
These approaches help maintain responsiveness and efficiency, even when you're working with a large dataset of symbols.