5 Steps to Create Optimization Dashboards in MQL5

5 Steps to Create Optimization Dashboards in MQL5
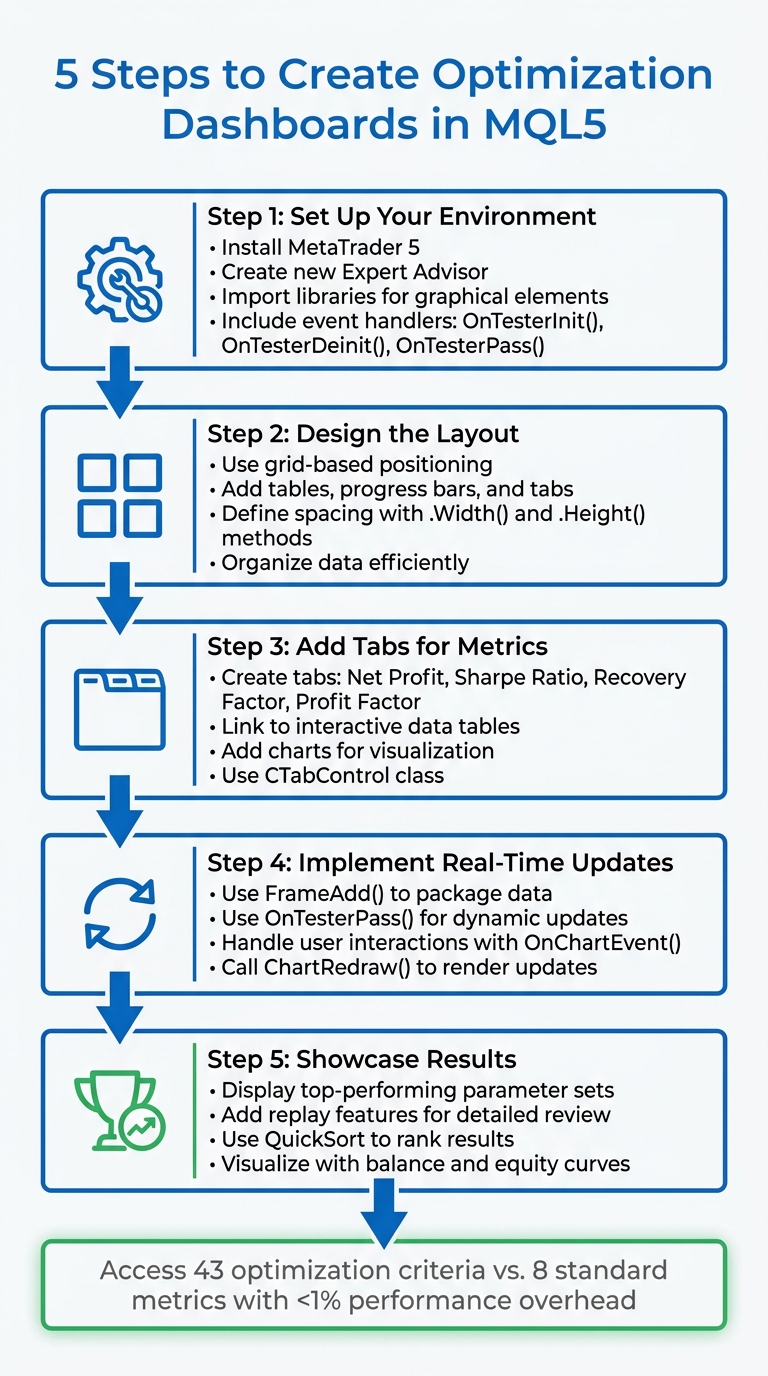
In MQL5, optimization dashboards transform raw strategy testing data into clear visual insights. These dashboards allow you to analyze multiple performance metrics like balance curves, Sharpe Ratio, and Profit Factor in real-time. By integrating custom graphical components, you can streamline strategy evaluation and save time during optimization. Here's a quick guide to building your own:
Key Steps
- Set Up Your Environment: Install MetaTrader 5, create a new Expert Advisor, and import necessary libraries for graphical elements like tables and charts.
- Design the Layout: Use grid-based positioning for tables, progress bars, and tabs to organize data efficiently.
- Add Tabs for Metrics: Create tabs for metrics like Net Profit and Recovery Factor, linking them to interactive data tables and charts.
- Implement Real-Time Updates: Use
FrameAdd()andOnTesterPass()to update dashboards dynamically during optimization. - Showcase Results: Display top-performing parameter sets and include replay features for a detailed performance review.
By combining MQL5's built-in tools with custom visualizations, you can simplify strategy analysis and make data-driven decisions with ease.
5 Steps to Build MQL5 Optimization Dashboards
Step 1: Set Up Your Development Environment
Install and Configure MQL5
Start by downloading and installing the latest version of MetaTrader 5 from its official website. This ensures you have access to all the graphical tools and libraries you'll need. Once installed, open the MetaQuotes Language Editor (MetaEditor). You can do this by pressing F4 in the MT5 terminal or clicking the IDE icon in the toolbar.
To create a new Expert Advisor (EA), use the MQL Wizard by pressing CTRL + N and selecting the "Expert Advisor (template)" option. This EA will be used to handle optimization data. Make sure to include the event handlers OnTesterInit(), OnTesterDeinit(), and OnTesterPass(). These are critical for launching your dashboard on a dedicated chart during optimization runs.
Organize your project by creating a folder (e.g., MQL5\\Experts\\FrameViewer). Within your code, call ChartRedraw() in OnInit() to ensure graphical elements render immediately.
Finally, import the necessary libraries to build the interface for your dashboard.
Import Required Libraries
To build your dashboard, start by importing essential classes from the MQL5 Standard Library using #include directives. The most important is <Controls\\Dialog.mqh>, which contains the CAppDialog class. This class acts as the main container for your dashboard.
For interactive elements like buttons, input fields, and text labels, include the following files:
<Controls\\Button.mqh>for buttons<Controls\\Edit.mqh>for input fields<Controls\\Label.mqh>for text labels
If you're working with custom graphics, include <Canvas\\Canvas.mqh> for the CCanvas class. To manage dynamic lists of UI elements, add <Arrays\\ArrayObj.mqh> for the CArrayObj class. Planning to display optimization results in a table? Include a custom Table.mqh file in your project directory.
Standard library files are usually located in the MQL5\\Include\\Controls\\ folder. For custom libraries or resources like branding or icons, store them in your project directory and include them using the #resource directive.
Lastly, implement the Destroy() method in your OnDeinit handler to clean up graphical objects when the program stops. This ensures everything is properly removed and prevents lingering elements from cluttering your workspace.
sbb-itb-3b27815
Step 2: Create Graphical Components
Design the Dashboard Layout
Start by sketching out your dashboard layout on a grid. Use tables to display results, charts for visualizing curves, and progress bars to show processing status. Arrange these elements by specifying their positions with X and Y coordinates, measured from the top-left corner.
To align and resize elements efficiently, use .Width() and .Height() methods, and define consistent spacing variables like x_gap = 10 and y_gap = 5. If your dashboard needs to display multiple categories of data, consider using CTabControl. This allows you to organize metrics into tabs, such as "Optimization", "Sharpe Ratio", or "Net Profit." Enhance usability by adding visual cues - change the background color with .ColorBackground(clrYellow) or highlight the active tab with .Pressed(true).
Initialize Objects with OnTesterInit
The OnTesterInit function is your starting point for creating all graphical components before optimization begins. When this function is included in your Expert Advisor (EA), MetaTrader 5 automatically opens a special "frame mode" chart. This visualization window displays data from testing agents without executing trades.
"The OnTesterInit() function is used to initiate an Expert Advisor before start of optimization for further processing of optimization results. It is always used together with the OnTesterDeinit() handler." - MQL5 Reference
Begin by creating a main container, such as CWindow or CPanel. Populate this container with elements like status bars, input fields, buttons, tables, and graphs using their respective Create() methods. Position each element using the OBJPROP_XDISTANCE and OBJPROP_YDISTANCE properties, typically anchored to CORNER_LEFT_UPPER. For advanced visualizations - like balance curves or profit distributions - use CCanvas or CGraphic classes to draw directly onto a bitmap. Once all elements are in place, call ChartRedraw() to ensure everything is rendered immediately.
Keep in mind that OnTesterInit has strict execution time limits. If your initialization code takes too long, the EA will stop, and the optimization process will be canceled. To avoid this, focus on writing efficient setup code. Batch property updates and steer clear of unnecessary loops to save time.
Next, move on to Step 3, where you’ll create interactive navigation.
Step 3: Build Tab-Based Navigation
Create Tabs for Different Metrics
Now that the initial setup is complete, it’s time to create a navigation system that organizes optimization data into easy-to-access categories. This approach ensures a clear, metric-specific breakdown of insights.
To achieve this, use the CTabControl class, which allows you to manage multiple CTab objects. Each tab will represent a specific metric category. A common configuration includes five tabs: Optimization (showing real-time pass results), Sharpe Ratio, Net Profit, Profit Factor, and Recovery Factor.
Each tab consists of two key components:
- CTabButton: This is the clickable navigation element.
- CTabWorkArea: This is where the content - such as tables and charts - will be displayed.
These buttons are directly linked to their respective workspaces. When a button is clicked, the OnChartEvent() function hides all other workspaces and displays the selected tab, creating a smooth navigation experience.
Fill Tabs with Data Tables and Charts
Once your tabs are set up, it's time to fill them with meaningful data and visuals. Use the CTableDataControl class (a subclass of CCanvas) to create grids and populate them with text. For better readability, especially when dealing with large parameter sets, alternate row colors in your tables.
For metric-specific tabs like Sharpe Ratio or Net Profit, focus on showcasing the top three results based on that criterion. Each tab should include at least two tables:
- One table for the optimization pass results.
- Another table detailing the specific input parameters used in those passes.
To provide a visual representation of performance, use the CGraphic library to add balance and equity curves. Functions like CurveAdd() and CurvePlotAll() allow you to overlay multiple curves on a single chart, giving users a clear view of performance trends.
To keep the data fresh, automate updates using the OnTesterPass() handler. This function captures data from testing agents as each optimization pass completes, ensuring that tables and charts reflect real-time results. Additionally, include a three-position toggle button in each metric tab. This feature lets users switch between detailed data for the top three individual passes, offering a deeper dive into the metrics.
With your tabs now interactive and populated with data, you're ready to move on to dynamic updates in Step 4.
Step 4: Handle Events and Update Data
Use the FrameGenerator Class
The FrameGenerator class serves as the core manager for transferring data between testing agents and the dashboard's visual components. It handles four main tester events: OnTesterInit, OnTester, OnTesterPass, and OnTesterDeinit.
Testing agents send data using the FrameAdd() function, which consolidates metrics like balance, equity, and performance stats into a single array. During the OnTesterPass event, the terminal retrieves this packaged data using FrameNext(), ensuring the dashboard updates in real time with each optimization pass.
"The Expert Advisor with these handlers is automatically loaded on a separate terminal chart... This copy of the Expert Advisor does not trade, but performs only service actions." (MQL5 Articles)
Since FrameAdd() can only handle one array and one numeric value, it's important to pack multiple metrics into a single synchronized packet. This ensures all critical data is delivered together. Once the graphical updates are processed, call ChartRedraw() to reflect the latest results visually.
Handle User Interactions
While the FrameGenerator ensures real-time data updates, the dashboard must also handle user inputs efficiently. These interactions are managed by the OnChartEvent() handler, which operates on a separate terminal chart. Keeping UI tasks separate from the multithreaded optimization process helps maintain system performance.
To streamline responsiveness, filter events within OnChartEvent() by checking for specific event IDs. For example:
if (id == CHARTEVENT_OBJECT_CLICK)
This ensures the code runs only when a user clicks on a dashboard element, avoiding unnecessary processing for actions like mouse movements. The sparam parameter identifies the specific component - such as a button or tab - that was interacted with.
For actions like tab switching, reset all other navigation buttons to inactive states. This approach ensures the UI remains visually consistent, with only one active section displayed at a time. To avoid naming conflicts and maintain clarity, use unique string constants for dashboard elements, such as:
#define Btn_TRADE "Btn_TRADE"
This ensures OnChartEvent triggers the correct logic every time.
To further optimize performance during high-speed optimizations, filter data on the agent side by sending frames only for passes that meet defined criteria, like a minimum profit percentage or trade count. This selective data handling keeps the dashboard interactive and efficient, even under heavy optimization loads.
How to create Panels and Informative Dashboards for MetaTrader 5 using MQL5
Step 5: Display Top Results and Add Replay Features
The final touch for your dashboard is to not only showcase the top results but also include a replay feature for a detailed analysis of your strategy's performance.
Show Top Optimization Results
To finalize data collection and sort results, use OnTesterDeinit(). During OnTesterPass(), store all frames in an array of structures, then apply QuickSort to organize them based on criteria like total profit or overall profitability. Consider adding a drop-down menu to let users choose how to sort the results - options could include metrics like Sharpe Ratio or Net Profit.
Display the ranked results in a table using CTable, showcasing the top three passes for each metric. To enhance clarity, plot balance and equity curves with tools like CGraph or CCanvas. Use color coding for better visual feedback - green for results exceeding the initial deposit, red for those below. Highlight the selected curve by increasing its line width or changing its color to black.
"It would be much better to view balance curves of multiple tests simultaneously, being able to analyze them even after the optimization." – MetaQuotes Software Corp.
If you're working with a large dataset, include a CProgressBar to show progress during result selection and sorting. Once this is set up, you can move on to implementing replay functionality.
Add Replay Functionality
Replay functionality allows you to step through optimization passes, offering a clear view of how your strategy performs over time. Start by creating a replay button (e.g., CButton m_reply_frames) and an input field for playback speed (e.g., m_sleep_ms).
Detect button clicks in OnChartEvent(), then loop through stored frames one by one. For each frame, update the dashboard components to display the relevant data. Introduce a delay - such as 100 milliseconds - between updates to ensure smooth playback.
"The data packet about the completed pass sent to the Expert Advisor on the chart is called a frame. It contains information about the pass number, values of EA's input variables with which the pass was started, and results of this pass." – MetaQuotes Ltd.
For a more dynamic visualization, use indicators like arrows for trade entries, dotted lines to mark take-profit or stop-loss levels, and icons to represent trade outcomes. Use FrameInputs() to retrieve input parameters for a specific pass, allowing you to recreate the exact test conditions. To keep the .mqd archive manageable, only record essential data like opening and closing balances. Store frame data in a dynamic array of pointers (CArrayObj) during optimization to ensure quick access during replay.
Conclusion: Creating MQL5 Optimization Dashboards
We've walked through each step of building a custom MQL5 optimization dashboard, from setting up the environment to enabling interactive replay. Together, these components create a tool that transforms raw data into actionable visual insights, taking strategy analysis to a whole new level.
By using MQL5's event handlers, this framework automates the entire dashboard lifecycle. It gives you access to 43 different optimization criteria, far surpassing the 8 standard metrics available in basic MetaTrader 5 reports - all while adding less than 1% performance overhead during optimization. With this setup, you can enjoy features like multi-curve visualization, post-optimization analysis, and interactive exploration, which go far beyond the capabilities of standard tester views. This combination of automation and visualization ensures a consistent and efficient approach to analyzing your strategies.
"The usual optimizer of MetaTrader 5 platform strategy tester turns into a visual one." – MQL5 Articles
On top of that, Traidies (https://traidies.com) simplifies the MQL5 development process by turning natural language descriptions into code. This AI-powered platform speeds up initial setup and automates backtesting with historical data, freeing up your time to focus on refining your dashboard's analytical features.
With your dashboard, you can now filter results by thresholds, replay optimization passes without re-running tests, and make decisions based on clear visual patterns. Considering that over 80% of human understanding comes from visual information, this tool empowers you to develop smarter, more effective strategies with confidence.
FAQs
How do I pack multiple metrics into one FrameAdd() call?
To include multiple metrics in a single FrameAdd() call in MQL5, you can use an array to group all the metrics together. Then, pass this array as the data parameter, along with the name, id, and value. Here's an example:
double metrics[] = {metric1, metric2, metric3};
FrameAdd("MetricsFrame", id, value, metrics);
This method allows you to streamline the process by combining several metrics into a single function call.
How can I keep OnTesterInit() fast enough to avoid canceling optimization?
To make sure OnTesterInit() runs smoothly and doesn't interrupt optimization, it's important to keep its processing minimal. This function handles preparation before the optimization process starts, and returning a value of zero signals that it has executed successfully. For better performance, avoid heavy calculations or time-consuming operations. Stick to only the necessary setup tasks to avoid delays that might interfere with the optimization workflow.
Can I replay optimization passes without re-running the tester?
No, MQL5 doesn't allow replaying optimization passes without re-running the tester. During the optimization process, data for each pass is stored in a *.MQD file. However, if you want to revisit or analyze these passes, you'll need to re-run the tester and repeat the optimization process. While you can visualize the results after the fact, replaying the passes without going through the testing phase again isn't an option.