Scenario Testing for MQL5 Strategies: Basics

Scenario Testing for MQL5 Strategies: Basics
Scenario testing in MQL5 allows traders to simulate specific market conditions to evaluate their trading strategies. Unlike traditional backtesting, which relies on historical data, scenario testing creates controlled environments to test strategies under various conditions like high volatility, multi-currency interactions, and execution delays. This approach helps refine strategies and manage risks effectively before live trading.
Key points include:
- Why it matters: Helps test strategies in trending, ranging, or volatile markets to reduce risks and improve performance.
- How it works: Uses the MT5 Strategy Tester with modes like "Every tick based on real ticks" for high accuracy.
- Setup essentials: Configure MT5, import historical data, and use tools like the MQL5 Cloud Network for large-scale testing.
- Common scenarios: High-volatility, trending, and ranging markets; each tests specific aspects of a strategy.
- Avoiding pitfalls: Prevent overfitting through walk-forward analysis and focusing on performance consistency across assets.
Scenario testing ensures strategies are prepared for diverse market conditions, enhancing their reliability and performance.
Setting Up the MT5 Strategy Tester for Scenario Testing
Installing and Configuring MT5
Getting your MT5 platform ready is the first step toward accurate scenario testing. Start by opening MT5 and pressing Ctrl+Shift+D to access the data folder. From there, place your .mq5 or .ex5 files into the MQL5/Experts directory. If you have the source code, open the .mq5 file in MetaEditor and press F7 to compile it into an executable .ex5 file. Once compiled, your Expert Advisor (EA) will show up in the Strategy Tester dropdown.
For historical data, manually load it by opening the desired symbol charts and scrolling back to ensure the full history is downloaded.
Using the MT5 Strategy Tester
To access the Strategy Tester, press Ctrl+R or go to View > Strategy Tester. Configure the tester by selecting your EA from the dropdown menu, picking a symbol and timeframe (e.g., EURUSD on H1), and setting your date range. You can choose from options like the entire history, the last month, the last year, or a custom range with specific start and end dates.
Adjust your account settings to reflect real trading conditions, including starting deposit, currency type, and leverage. When it comes to tick generation, select a mode based on your testing needs. The "Every tick based on real ticks" mode delivers the most detailed results, while "1 minute OHLC" offers a faster but slightly less detailed option.
For added precision, enable forward testing by splitting historical data to avoid curve-fitting. Also, the "Random Delay" mode can simulate network delays and execution slippage, creating a more realistic testing environment.
Once you've configured the Strategy Tester, ensure all necessary tools and resources are in place for a smooth testing process.
Required Tools and Resources
In addition to the MT5 platform, you'll need reliable historical market data. MT5 automatically downloads data through its built-in data center, but for specific scenarios, you can create custom symbols in the Symbols window and import your own historical data via CSV files.
For large-scale optimization tasks, take advantage of the MQL5 Cloud Network, which provides distributed computing power. Keep in mind that network agents are limited to using no more than 4GB of RAM or writing more than 4GB of data to disk. If you’re planning long testing sessions, consider using a VPS. MetaQuotes offers integrated VPS services starting at around $15.00 per month.
To observe trade entries and exits visually, enable Visual Mode by checking the appropriate box. Use the Journal tab in the Strategy Tester to track runtime errors or server issues during simulations. Finally, the MQL5 IDE includes a debugger, allowing you to step through your program on historical or live data to troubleshoot logic errors.
sbb-itb-3b27815
Creating Custom Market Scenarios
Building Volatility-Based Scenarios
You can simulate rare and extreme market conditions by importing external tick data from sources like Dukascopy using CSV files. This allows you to test your strategies under a variety of challenging scenarios, enhancing their reliability.
To automate the creation of these scenarios, MQL5 scripts can utilize mathematical distribution laws. The Math Statistics library supports distributions like Normal, Uniform, Beta, and Cauchy, enabling you to generate ticks and bars that replicate specific market trends or noise patterns. For example, in August 2019, a technical demonstration using the TestLoad.mq5 script imported 354,400 ticks from the "EURUSD1_tick.csv" file (data from August 1–2, 2019). The terminal then converted this data into 2,697 one-minute bars, which were used for strategy testing.
If you want to evaluate how your strategy performs in low-liquidity environments, you can adjust spreads using the CustomSymbolSetInteger function with the SYMBOL_SPREAD parameter. By setting fixed spreads or adding markups to floating spreads, you can see how increased trading costs might affect your strategy's profitability.
Once you've tested individual scenarios, move on to assessing how your strategies perform across multiple instruments.
Testing Multi-Symbol Strategies
The MT5 Strategy Tester makes multi-currency testing straightforward by automatically synchronizing historical data for all symbols that your Expert Advisor (EA) interacts with during a test run. If your EA uses additional instruments through functions like SymbolSelect, iCustom, or CopyRates, the tester will add those symbols to the Market Watch and download their historical data automatically.
To ensure complete historical data is available, open charts for all required symbols and manually scroll back to download their history. Additionally, in your EA's OnInit() function, you can explicitly request secondary symbol data with a command like SymbolSelect("SecondarySymbol", true) before starting the test.
Synchronization of bars across symbols is critical to avoid timing mismatches in inter-market logic. In your OnTick() function, include a check to confirm that the last bars for all used symbols have the same opening time before executing any inter-market logic. As stated in MQL5 Programming for Traders, "A state is considered synchronized when the last bars of all used symbols have the same opening time".
After ensuring synchronization, you can refine your strategies further with optimization passes.
Using Optimization Passes for Scenario Variations
Optimization passes allow you to test thousands of parameter combinations across various market scenarios to identify the most stable settings. Using the Fast Genetic-Based Algorithm can speed up this process, while forward testing helps validate the results. This approach strengthens both risk management and strategy performance.
For more advanced optimization, the OnTester() handler lets you define custom criteria, such as targeting specific drawdown-to-profit ratios or ensuring consistent win rates. You can also use the ParameterSetRange function to programmatically adjust parameter ranges during optimization, while TesterStatistics retrieves essential financial metrics during or after the test.
When validating results, always use "Every Tick" or "Real Ticks" mode for accuracy. Testing in faster modes like "1 Minute OHLC" or "Open Prices Only" may produce overly favorable results that don't reflect real market conditions. As noted in MQL5 documentation, higher accuracy modes require more time but provide more reliable insights.
How To Use The MT5 Strategy Tester For Backtesting (EA Testing Explained)
Running and Analyzing Scenario Tests
MT5 Tick Generation Modes: Speed vs Accuracy Comparison
Running Scenario Tests in MT5
To start scenario testing in MetaTrader 5, open the Strategy Tester by pressing Ctrl+R or navigating to View → Strategy Tester. From there, choose your Expert Advisor, select a symbol and timeframe, and define the testing period (such as Last Year, Entire History, or a Custom Period). Make sure to set the initial deposit, currency, and leverage to match your live trading conditions.
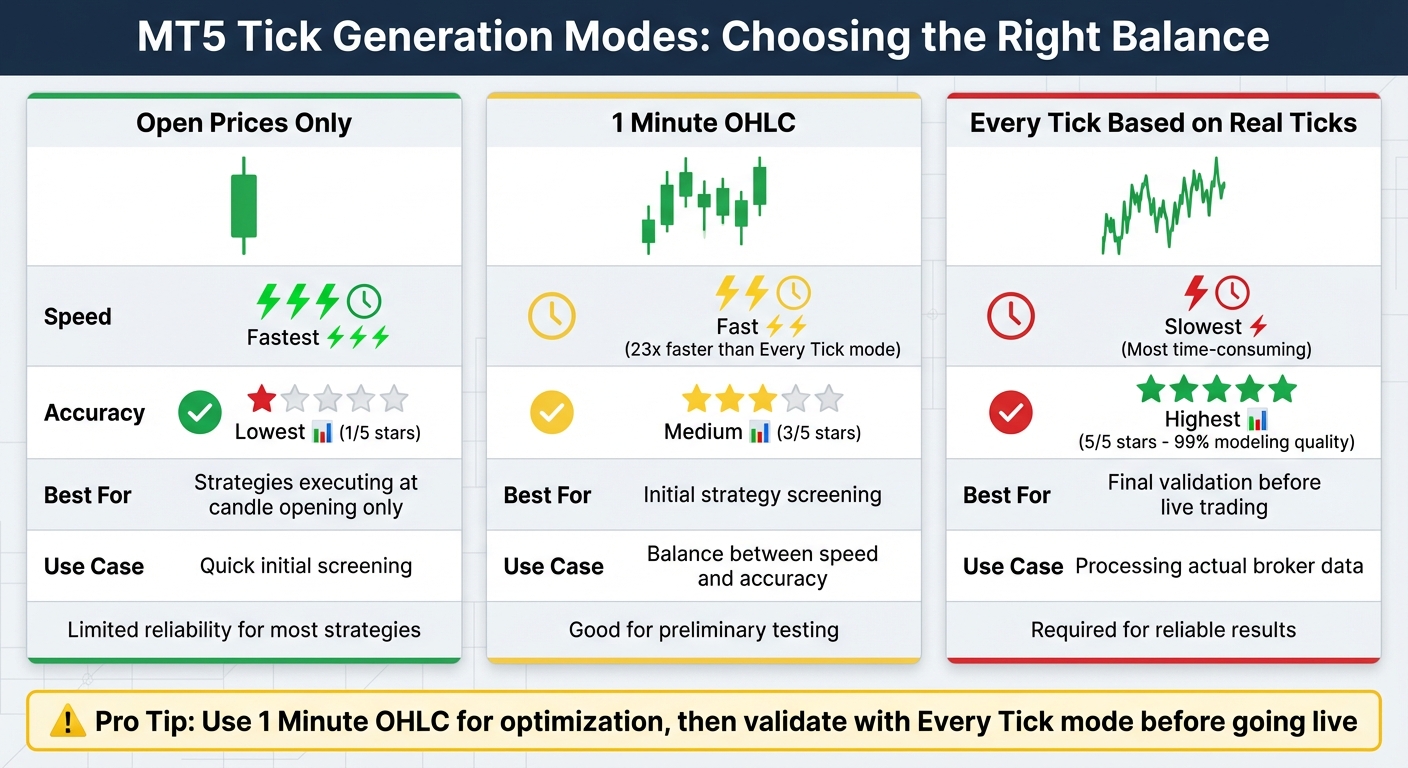
The accuracy of your simulation depends on the tick generation mode you choose. Here’s a quick breakdown:
- Open prices only: This is the fastest mode but works reliably only for strategies that execute at the opening of candles.
- 1 Minute OHLC: Offers a balance between speed and accuracy, making it ideal for initial strategy screening.
- Every tick based on real ticks: The most accurate option, as it processes actual broker data and handles a significantly higher volume of ticks. However, it is much slower - testing in "1 Minute OHLC" mode can be up to 23 times faster than "Every tick" mode.
Once your settings are configured, click Start. You can enable Visual mode to identify potential issues, such as trades placed during low-liquidity periods.
After running the test, review the performance metrics to evaluate how well your strategy performs.
Reading Performance Metrics
Once the test is complete, head to the Backtest tab to examine the key performance metrics. Here's what to focus on:
- Net Profit: This is your gross profit minus gross loss and serves as the primary measure of your strategy's success.
- Profit Factor: This ratio of gross profit to gross loss should ideally range between 1.5 and 2.5. Values above 3.0 might indicate over-optimization.
- Maximum Drawdown: The largest equity decline from peak to trough should generally stay below 20%–30%.
Other important metrics include the Recovery Factor and Sharpe Ratio. A Sharpe Ratio above 1.0 is acceptable, while anything above 2.0 is excellent. Be cautious with Win Rate - a high win percentage isn't always a good sign if your average loss outweighs your average win. Also, ensure the Expected Payoff (average profit or loss per trade) is positive. Lastly, check that Modeling Quality reaches 99% when using real ticks.
These metrics will guide you in refining your strategy while avoiding pitfalls like over-optimization or curve-fitting.
Refining Strategies Based on Results
Use insights from your scenario tests and metrics to adjust and improve your strategy.
"Backtesting in MT5 is not about proving yourself right; it is about trying to prove your strategy wrong." - Sofia Petrov, Quantitative Specialist, FXNX
To ensure your strategy is robust, implement Out-of-Sample testing. For instance, optimize your parameters using historical data from 2021–2023, then test these parameters on forward data, such as 2024. If the results differ drastically, your strategy might be overfitted to past data. During optimization, look for parameter ranges - like RSI values between 12 and 16 - that consistently perform well, rather than isolated peaks, which could signal random success.
Keep an eye on the Journal tab during and after testing to identify runtime errors, such as "Order not found" (Error 4754) or "Not enough memory" (Error 4007). If results from faster testing modes seem overly optimistic, re-run the test using the Every tick mode for more reliable accuracy. Additionally, simulate realistic conditions by setting execution delays (e.g., 50–100ms) and using floating spreads to assess how slippage impacts tight stop-losses.
Common Scenario Types and Best Practices
Comparison of Scenario Types
Different market conditions call for different testing strategies. High-volatility scenarios are designed to mimic extreme price swings, like those seen during major news events or market crashes. These tests are great for seeing how your strategy handles stress but don’t reflect day-to-day trading conditions.
Trending market scenarios are useful for testing strategies that rely on momentum or breakouts. These scenarios help determine if your approach can make the most of strong directional moves. However, because markets often move sideways, a strategy that thrives in trending conditions might falter when the market becomes range-bound.
Ranging market scenarios, on the other hand, focus on low-volatility, sideways price action. These conditions are common during forex off-peak hours or when traders are waiting for key economic data. Trend-following strategies tend to underperform in these scenarios, but that doesn’t mean the strategy itself is flawed - it’s just not suited for this type of market.
| Scenario Type | Pros | Cons |
|---|---|---|
| High-Volatility | Tests performance under extreme conditions | Not representative of typical trading |
| Trending Market | Validates strategies for strong trends | Struggles in ranging markets |
| Ranging Market | Tests performance in low-volatility periods | Unsuitable for trend-following strategies |
Understanding these scenarios lays the groundwork for preventing overfitting and debugging, which are crucial for building reliable strategies.
Preventing Overfitting in Scenario Testing
One of the biggest risks in scenario testing is creating a strategy that looks great on historical data but fails in live trading. To combat overfitting, use walk-forward analysis. This method splits historical data into segments, allowing you to optimize your strategy on one segment and validate it on the next untouched segment. This ensures your strategy isn’t just tailored to past noise but reflects a genuine edge.
Keep your strategy straightforward by limiting it to 3 to 5 core parameters. Adding too many rules or indicators increases the likelihood of overfitting. When optimizing, aim for performance plateaus rather than sharp peaks. For example, if your strategy only works with an RSI value of exactly 14 but fails with 13 or 15, it’s likely too sensitive to minor market fluctuations.
Revalidate your results using the "Every tick based on real ticks" mode. Simplified modeling modes can sometimes produce overly optimistic results, so this step helps confirm your strategy’s reliability.
Once overfitting is under control, move on to debugging and refining your approach.
Debugging and Improving Strategies
Debugging is a critical step to confirm your scenario testing results and ensure your strategy’s reliability. If your strategy behaves unpredictably during scenario tests in MT5, use the debugger to go through your code step-by-step. Set breakpoints at key decision points, such as when your Expert Advisor decides to enter or exit a trade, and inspect variable values to understand its behavior.
Check the Journal tab for error codes and use the GetLastError() function to identify runtime issues, such as "Order not found" (Error 4754) or trade server rejections. If you notice differences between fast-mode and real tick results, it could signal overfitting to predictable, generated price points rather than actual market behavior.
Finally, test your strategy across various assets and timeframes using the Strategy Tester. If it performs well on one currency pair, like EUR/USD, but fails on others, such as GBP/USD or USD/JPY, it might be overfit to specific market quirks. A robust strategy should show consistent behavior across similar market conditions, even if its performance varies. This consistency is a key indicator of a strategy’s reliability.
Conclusion: Getting Started with Scenario Testing in MQL5
Summary of Main Steps
To dive into scenario testing, here's a quick breakdown of the process:
- Open the Strategy Tester (Ctrl+R) and select your Expert Advisor (.mq5 or .ex5).
- Pick the symbol and timeframe you want to test.
- Choose the tick mode: use Every tick for precision or 1 Minute OHLC for quicker evaluations.
- Set up account parameters like deposit, leverage, and custom delays to mimic real-world trading conditions.
- Turn on Forward Testing to avoid curve fitting.
- Before going live, confirm the results using the "Every tick based on real ticks" mode for maximum accuracy.
Benefits of Scenario Testing for Strategy Development
Scenario testing helps you spot vulnerabilities early, ensures your strategy can handle different market conditions, and provides crucial insights like Maximal Drawdown and Profit Factor. With MT5's multi-threading capability, all CPU cores are utilized for faster processing, and the MQL5 Cloud Network uses thousands of remote agents to speed up complex tests. These features make it easier to adapt your strategy to changing market dynamics, giving you greater confidence in its performance.
Next Steps with Traidies

Once you're comfortable with the basics of scenario testing, Traidies can simplify your workflow even further. Using AI-powered tools, you can describe your strategy in plain language, automatically generate MQL5 code, and run backtests with historical data. This removes the need for manual coding, allowing you to focus on fine-tuning your strategy. After generating the .mq5 or .ex5 files, import them into MT5's Experts folder and start testing immediately using the steps outlined above. Combining AI-assisted tools with robust scenario testing gives you a faster, more efficient way to create profitable automated trading strategies.
FAQs
When should I use scenario testing instead of normal backtesting in MT5?
When working with MT5, scenario testing is an excellent tool for analyzing how a trading strategy behaves under specific market conditions. This includes situations like market shocks or unusual events that standard backtesting might overlook. By simulating rare or extreme scenarios, it allows you to assess the strategy's resilience and adaptability, offering insights that go beyond traditional backtesting. This approach ensures a broader evaluation of your strategy's performance in predefined, challenging situations.
How do I build a realistic high-volatility scenario with real tick data?
To simulate a high-volatility scenario in MQL5, you should use the 'Every tick based on real ticks' mode in the strategy tester. This approach utilizes actual historical tick data, which allows for more precise simulations of price fluctuations during volatile market periods. Make sure to obtain detailed tick data using functions like CopyTicks() and integrate it into your testing setup. This will help you replicate real market conditions more accurately.
What’s the best way to confirm my EA isn’t overfit before going live?
To make sure your Expert Advisor (EA) is ready for live trading and not overfit, it’s important to go beyond basic backtesting. Use robust validation techniques like:
- Validation-within-validation (V-in-V): This double-layered approach helps assess how well your EA performs on unseen data.
- Combinatorially Purged Cross-Validation (CPCV): This method ensures your results aren’t skewed by overlapping data, giving a clearer picture of your EA’s robustness.
- Out-of-sample testing: By testing on completely separate data, you can evaluate how your strategy handles market conditions it hasn’t seen before.
- Walk-forward analysis: This technique simulates live trading by testing and recalibrating your EA over rolling time periods.
Be cautious about over-optimizing your strategy. A system that’s too finely tuned to past data may struggle to handle real-world market shifts. The goal is to create an EA that performs well across a variety of conditions, not just in historical scenarios.