Backtesting Diversification with AI Tools

Backtesting Diversification with AI Tools
Backtesting is the process of evaluating investment strategies using historical data. For diversified portfolios, it involves testing multiple assets together to understand their interactions, risk reduction, and return potential. AI tools simplify this process by automating simulations, identifying hidden correlations, and reducing testing time. Platforms like Traidies even allow users to design strategies in plain language, making backtesting accessible without coding.
Key Takeaways:
- AI Benefits: Faster simulations, uncovering correlations, and testing under various market conditions.
- Data Preparation: Align timelines, adjust for corporate actions, and fix errors to ensure accuracy.
- Metrics to Track: Sharpe Ratio (risk-adjusted returns), Maximum Drawdown (losses), and Profit Factor (profit vs. loss).
- Testing Phases: Split data into design, validation, and holdout sets to avoid bias.
- Live Trading Transition: Start small, account for slippage, and monitor performance closely.
AI-driven tools are transforming backtesting, helping traders refine strategies for better diversification and risk management.
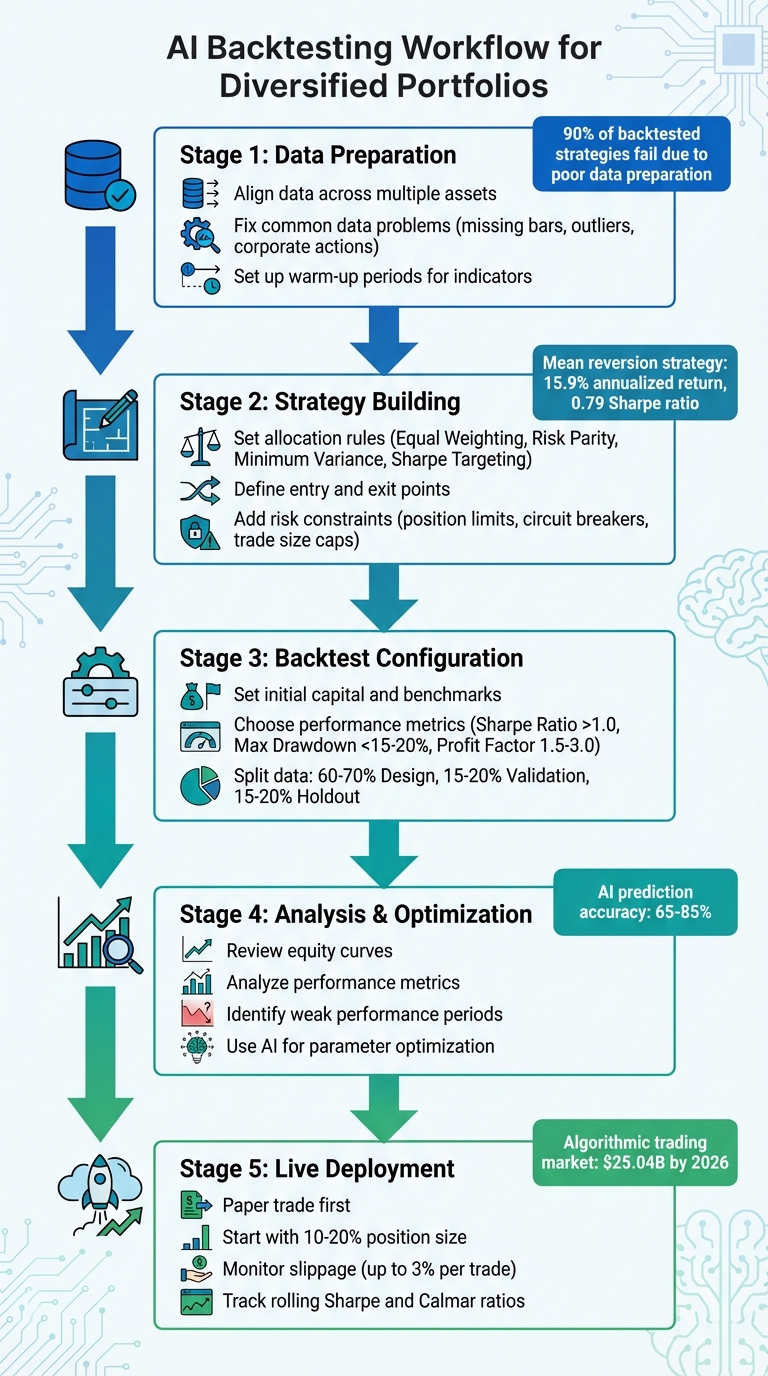
AI Backtesting Workflow: From Data Preparation to Live Trading
How to Backtest on 47 Assets, 10 Years Data: Diversification Strategy Using Python
sbb-itb-3b27815
Preparing Historical Data for Multi-Asset Backtesting
Having clean and well-aligned data is the backbone of effective backtesting, especially when dealing with diversified portfolios. With multiple assets trading on different exchanges, varying schedules, and inconsistent data quality, the challenge becomes even greater. Research shows that more than 90% of backtested strategies fail when implemented in live trading, and poor data preparation is often to blame. By laying a solid groundwork, you can avoid misleading signals and unrealistic performance metrics. Here's how to align data, address common issues, and set up warm-up periods to ensure reliable backtesting results.
Aligning Data Across Multiple Assets
When backtesting across multiple assets, creating a unified timeline is non-negotiable. Start by establishing a master timeline with standardized dates and intervals - daily or hourly, for example - for all assets. Reindex each asset to this timeline to pinpoint gaps where data might be missing for one asset but present for others. For instance, some data sources may only provide "Close" prices or skip holidays, while others offer full OHLC (Open, High, Low, Close) data. Use forward filling (ffill()) to fill in these gaps, carrying the last known price into missing slots. This ensures your backtester works with a continuous data stream across all assets.
Additionally, always rely on Adjusted Close prices, which account for stock splits and dividends. This step eliminates artificial price jumps that could lead to false trading signals [[9]](https://robitrader.com/articles/How to Do Scientific Backtesting in AI Trading).
Fixing Common Data Problems
Automated checks can help maintain the integrity of your data. For instance, verify that High prices are always greater than or equal to Low, Open, and Close, and that Volume is never negative. Data errors, such as outliers, can create price spikes that mislead your strategy. To address this, flag and remove prices that deviate more than 10 standard deviations from a rolling mean.
Another critical step is standardizing all timestamps to UTC. This prevents lookahead bias, where future information from one market could inadvertently influence trades in another. Lookahead bias alone can undermine around 15% of strategies [[9]](https://robitrader.com/articles/How to Do Scientific Backtesting in AI Trading).
| Data Issue | Impact on Backtesting | Recommended Resolution |
|---|---|---|
| Missing Bars | Misleading indicators & gaps | Reindex and forward fill (ffill()) |
| Outliers | False signals & instability | Use rolling standard deviation filters |
| Corporate Actions | Artificial price jumps | Adjust for splits and dividends |
| Timezone Drift | Misaligned bar logic | Standardize timestamps to UTC |
Setting Up Warm-Up Periods
Indicators like the 200-day Moving Average or RSI require a warm-up period to stabilize before they can generate reliable signals. In multi-asset backtesting, warm-up periods are equally important for synchronizing data streams across assets with different start dates or liquidity levels. This ensures that your strategy doesn't inadvertently rely on data that wouldn't have been available at the time of a trade. Properly implemented warm-up periods are essential for avoiding these pitfalls and ensuring your portfolio rebalancing is based on accurate, real-time data.
Building Diversification Strategies
Creating effective diversification strategies requires clear, rule-based systems for capital allocation, rebalancing, and risk management. These rules should be grounded in clean, well-aligned data to enable reliable backtesting and decision-making.
Setting Allocation Rules and Rebalancing Triggers
Allocation rules determine how capital is distributed across assets, often tested using historical data. Common approaches include:
- Equal Weighting (1/n): Distributing capital evenly across assets.
- Risk Parity: Adjusting positions based on asset volatility.
- Minimum Variance: Prioritizing lower-risk assets.
- Sharpe Targeting: Allocating based on risk-adjusted returns.
Rebalancing ensures the portfolio stays aligned with its intended structure. This can be triggered when an asset's weight drifts beyond a specific threshold (e.g., 3%) or on a fixed schedule, such as weekly or monthly. Drift bands (e.g., 1%–5%) and caps on individual holdings (e.g., limiting a token to 25%) help control trading frequency and reduce unnecessary churn.
Defining Entry and Exit Points
Clear, programmable entry and exit conditions are essential for strategy execution. For example, you might set rules like: "Buy when the RSI drops below 30 and then closes above it". Breakout models can include specific time frames (e.g., 10:00 AM to 12:00 PM for a warm-up period) and confirmation filters, such as the Stochastic Oscillator being at or below 20, to validate signals.
Mean reversion strategies focus on assets expected to revert to their long-term averages. For instance, a strategy applied to Dow Jones data involved buying the 10 worst-performing stocks at market close and selling them the next day. This approach achieved an annualized return of 15.9% with a Sharpe ratio of 0.79, outperforming key benchmarks.
Once these conditions are defined, incorporating risk constraints strengthens the overall approach.
Adding Risk Constraints and Filters
Risk filters are critical for managing exposure and avoiding overconcentration. Examples include:
- Position Limits: Restricting the number of open trades at any given time.
- Circuit Breakers: Halting trading if drawdowns exceed 12%.
- Trade Size Caps: Limiting any single trade to 1% of total capital.
Correlation thresholds can also help prevent unintended risks. For example, U.S. large-cap ETFs and global equity ETFs often show correlations between 0.80 and 0.90, with up to 35% overlap in top holdings, increasing portfolio vulnerability. AI tools can assist in optimizing these filters, improving backtesting processes, and identifying hidden relationships between assets.
"Diversification is not about collecting the highest number of holdings; it's about making sure those holdings respond differently to the same events." - Alexander Harmsen, Co-founder and CEO of PortfolioPilot.
Setting Up AI Backtesting Parameters
Once you've established diversification rules and prepared your data, the next step is to configure backtesting parameters. These parameters ensure that your AI evaluations closely resemble real-world market conditions, avoiding skewed or overly optimistic results. They dictate how tests are conducted, what metrics are tracked, and how predictive the outcomes are for live trading.
Setting Initial Capital and Benchmarks
Start by defining a realistic initial capital amount, such as $10,000 or $50,000, and opt for dynamic position sizing that adjusts with your account balance. Fixed position sizes - like allocating $10,000 per trade - can distort long-term performance metrics, making them less reliable.
Choose benchmarks that give context to your strategy's performance. For example, compare your portfolio's results to the average return of its individual assets to see if diversification is adding value. You can also measure your strategy against a buy-and-hold approach or equity indices like the S&P 500. This helps determine if active rebalancing offers any real advantage.
Don't overlook trading frictions like commissions, slippage, and liquidity constraints. These should be factored in from the beginning. To test your strategy's resilience, simulate scenarios with higher costs - 1.5 to 2 times the usual fees and slippage - to ensure it holds up under tougher conditions.
These foundational settings are crucial for producing trustworthy performance evaluations.
Choosing Performance Metrics
Next, focus on metrics that objectively measure how effective your diversification strategy is. The Sharpe Ratio is a classic choice, assessing risk-adjusted returns by calculating the excess return per unit of volatility. A ratio above 1.0 is solid, above 2.0 is strong, and 3.0 or higher is exceptional. If your strategy has uneven returns, the Sortino Ratio is a helpful alternative, as it focuses only on downside volatility.
Another key metric is Maximum Drawdown (MDD), which tracks the largest peak-to-trough loss. Professional traders aim to keep this below 15–20%, as recovering from a 50% drawdown requires a 100% gain just to break even. The Calmar Ratio - annualized return divided by MDD - further evaluates whether your returns justify the risks taken. Lastly, the Profit Factor, which measures gross profit relative to gross loss, should ideally fall between 1.5 and 3.0 for a strategy to be considered reliable.
"The Sharpe Ratio helps you determine whether the returns of a strategy are due to good investment decisions or just the result of taking on excessive risk." - Tradetron
By using these metrics, you can better understand how well your strategy performs across different scenarios.
Splitting Data for Training and Testing
To avoid bias, split your historical data chronologically rather than randomly. This prevents look-ahead bias and ensures a more realistic evaluation. A common approach divides the data into three parts:
- Design (In-Sample): Use 60–70% of the earliest data to develop your model.
- Validation (Out-of-Sample 1): Allocate 15–20% of the next segment to test model variations without making further adjustments.
- Holdout (Out-of-Sample 2): Reserve the final 15–20% as a one-time test to confirm that the strategy works on unseen data.
Make sure your dataset covers different market conditions - bull, bear, and sideways - to avoid over-optimizing for a specific environment. Look for parameter plateaus, where performance remains stable across a range of values, instead of relying on a single "magic number" that might just be noise.
"Overfitting = tuning to noise. If tiny tweaks kill results, you never had an edge." - Forvest
Running Backtests and Analyzing Results
Once your parameters are set, it's time to run backtests and see how your diversification strategy holds up against historical data. This step turns theoretical ideas into measurable results, giving you a clear picture of whether your approach achieves the risk-adjusted returns you're aiming for.
Running Backtests and Checking Equity Curves
Start by running your backtest and reviewing the equity curve, which shows how your portfolio's value changes over time. Compare your strategy's curve - often displayed in green - against a buy-and-hold benchmark, typically shown in red. This comparison helps you determine if your active diversification strategy outperforms simply holding a market index.
A well-diversified portfolio generally produces a smoother equity curve compared to single-asset strategies. For example, combining assets like SPY (stocks) and TLT (bonds), which have a correlation of -0.177, can lead to reduced volatility and steadier growth. Pay close attention to drawdown periods, which highlight the declines from peak to trough. These dips reveal the psychological and financial challenges you might face during real-world trading.
"Drawdown is the reality check of a strategy. PnL shows you the destination; drawdown shows you the journey." - Strategy Arena
It's also important to analyze how your equity curve performs under different market conditions. Does your portfolio maintain upward momentum during bearish markets, or does it mirror broader trends? For instance, in April 2024, Ryan O'Connell (CFA, FRM) tested a mean reversion strategy on the Dow Jones Industrial Average over a 10-year period using Datalore. His approach, which involved buying the 10 biggest daily losers and selling them the next day, achieved an annualized return of 15.90% with a Sharpe ratio of 0.79. This outperformed the SPDR Dow Jones Industrial Average ETF (DIA), which returned 13.11% with a Sharpe ratio of 0.75. The equity curve comparison showed how an initial $100,000 investment grew under both strategies.
Once you've reviewed the equity curve, the next step is to dive into performance metrics for a deeper understanding.
Reading Performance Metrics
Performance metrics are essential for evaluating the effectiveness of your strategy. The Sharpe Ratio is often the go-to metric for risk-adjusted performance. A ratio above 1.0 suggests strong performance, while anything above 2.0 is considered exceptional. This metric essentially measures how much return you're earning for the risk you're taking.
Equally important is Maximum Drawdown. A drawdown exceeding -30% is a red flag, especially if the recovery period drags on for months. Keep in mind that recovering from a 50% loss requires a 100% gain just to break even. Another key metric is the Profit Factor, which is the ratio of gross profits to gross losses. A value above 2.0 indicates that your strategy earns twice as much as it loses.
Don't forget to check the trade count to ensure statistical reliability. A good backtest should include at least 100 trades, though 300 or more is ideal to avoid results being skewed by chance. For strategies that execute hundreds of trades annually, even small costs like slippage (0.1% to 1%) and fees (0.1% to 0.5%) can turn a seemingly profitable backtest into a losing strategy in practice.
"The combined, diversified portfolio typically exhibits a higher Sharpe Ratio and a lower Maximum Drawdown compared to the average of the individual, single-asset strategies." - PyQuantLab
With these metrics in hand, the next step is to identify periods where your strategy underperforms.
Finding Weak Performance Periods
AI tools can be incredibly useful for identifying when and why your strategy struggles. By segmenting market phases - bull, bear, and sideways - you can pinpoint if poor performance clusters around specific conditions. Walk-forward validation is especially helpful for this. It simulates real-world conditions by training on one segment of data and testing on the next, revealing any weaknesses in your strategy's logic.
Stress testing adds another layer of insight. Try introducing small variations, like jittering prices by ±0.5–1.0% or shifting rebalancing dates by 1–2 days. If your strategy falls apart under these minor tweaks, it’s likely overfitted to historical data rather than capturing a genuine edge. AI tools can also help identify whether performance peaks are due to noise or robust strategy parameters, ensuring your approach remains reliable across different scenarios.
"If you can't describe the strategy in one sentence, it's probably over-fitted." - Reza Ebrahimi, Forvest
Regularly check your correlation matrix to ensure your portfolio remains diversified. For example, research by Vanguard found that U.S. large-cap ETFs (like IVV) and global equity ETFs (like EFA) often have high positive correlations between 0.80 and 0.90, which can spike during market stress. When correlations exceed 0.80, the benefits of diversification disappear just when you need them most. AI-driven factor analysis can help uncover these hidden relationships and address them before you commit real capital.
Refining and Deploying Strategies
After backtesting, the next step is fine-tuning your strategy to improve its performance while avoiding overfitting. AI tools can test thousands of parameter combinations, but the goal is to identify settings that remain reliable across varying market conditions.
Using AI for Strategy Optimization
AI-powered tools can run extensive multi-parameter grid searches, evaluating combinations like EMA lengths, RSI thresholds, and rebalancing intervals. Techniques such as genetic programming, reinforcement learning, and Bayesian optimization are particularly useful for adjusting settings dynamically, ensuring the strategy works well across different market environments.
The focus should be on finding stable "parameter plateaus" instead of chasing a single "magic number" that performed well historically but could fail in live trading. For example, if a strategy works consistently with a 50-day moving average and also performs well with 48- or 52-day averages, it indicates a stable and reliable parameter range rather than a fragile, one-off success.
"Good optimization clarifies the logic and picks stable settings. Bad optimization hunts the best historical number and calls it 'edge.'" - Forvest Research
Once robust parameters are identified, these should be validated with out-of-sample data for further reliability.
Testing Optimized Strategies
After optimization, it's crucial to test the strategy on out-of-sample (OOS) data to confirm its durability. A standard approach is to reserve the last 20% of available data for OOS testing.
Walk-forward analysis is another effective method. This involves optimizing the strategy on rolling data windows and testing it on subsequent periods. For instance, you might optimize using 12–18 months of data and then test on the next period. This approach helps ensure the strategy adapts to changing market conditions.
Monte Carlo simulations provide additional validation by running thousands of trade variations with randomized slippage and fees. If live drawdowns exceed historical extremes by 1.5 to 2 times, it’s a red flag that the strategy might be too fragile for real-world application.
Moving to Live Trading
Transitioning to live trading requires careful execution. Start by paper trading your optimized strategy in a demo environment to confirm that live results align with backtested performance. When moving to real capital, begin with just 10–20% of your intended position size. Key metrics like the Sharpe Ratio (above 1.0) and Profit Factor (above 1.5) should be monitored closely.
Be aware that real-world slippage can eat into profits - up to 3% per trade on some exchanges. To mitigate this, deploy your strategy on a Cloud VPS to minimize latency and reduce the risk of missed stop-losses. Use tools like trailing stops and fixed fractional risk sizing to prevent any single trade from having an outsized impact on your portfolio. Additionally, monitor rolling Sharpe and Calmar ratios, and watch for short-term volatility spikes that exceed long-term averages by 2.5 times - this could signal a market shift requiring adjustments.
To streamline the process, platforms like Traidies allow you to describe your strategy in natural language, automatically generate MQL5 code, and backtest it with historical data - all without needing to write code manually. This makes it easier to refine, test, and deploy strategies efficiently and with greater confidence.
Conclusion: Using AI for Better Diversification
Benefits of AI Backtesting
AI-powered backtesting takes what used to be a time-intensive process and makes it significantly faster, compressing weeks or even months of manual effort into just days or hours. By testing strategies across various asset classes and market conditions, these tools uncover patterns and correlations that might otherwise go unnoticed. For example, AI might reveal that two ETFs - which appear unrelated - actually share 35% exposure to the same tech companies, a connection that could be crucial during periods of market stress. Beyond identifying these hidden links, AI tools also factor in real-world trading variables like slippage, bid-ask spreads, and transaction costs, delivering results that are both detailed and realistic.
"AI agents deliver speed, consistency, and scale while reducing manual errors. They help traders make better decisions faster and maintain discipline in volatile markets." - ION Group Research
AI’s prediction accuracy currently falls between 65% and 85%, showcasing its reliability across different market conditions. However, poor data quality can lower validation accuracy by 15% to 35%. The good news? AI tools are equipped to automatically detect and fix these issues during the data preparation stage. This combination of speed, accuracy, and adaptability makes AI backtesting an indispensable resource for traders looking to refine their strategies.
Next Steps for Traders
To get started with AI-driven backtesting, consider platforms like Traidies. It simplifies the process by letting you describe strategies in plain English, automatically generating MQL5 code, and running backtests on historical data - all without requiring coding skills.
Once you’ve developed a strategy, test it with out-of-sample data to evaluate how it performs under unfamiliar market conditions. Incorporating walk-forward analysis can further ensure your approach adjusts as markets evolve. Begin with demo or paper trading to identify any potential weaknesses, then transition to live trading with smaller positions while keeping a close eye on performance.
With the algorithmic trading market expected to hit $25.04 billion by 2026, AI-powered backtesting is becoming a key tool for traders at all levels to refine and strengthen their diversification strategies.
FAQs
How do I avoid overfitting when backtesting a diversified portfolio?
When backtesting, it's crucial to avoid overfitting so your strategy remains reliable in live trading. Overfitting happens when a model is too closely tailored to historical data, making it less effective in real-world scenarios. To keep your strategy adaptable across different market conditions, consider these approaches:
- Time-Based Data Splits: Divide your data into separate segments for training and testing. This ensures your model is evaluated on unseen data, providing a clearer picture of its performance.
- Walk-Forward Validation: Test your strategy on rolling time windows. This method mimics live trading by continuously updating your model as new data becomes available.
- Parameter-Range Testing: Instead of fine-tuning for a single "best" parameter, test a range of values. This reduces the risk of your model being overly reliant on specific historical patterns.
And most importantly, avoid making your models overly complex or excessively optimized. Simpler strategies often generalize better, increasing their reliability when applied to real market conditions.
What data issues most often ruin multi-asset backtests?
The biggest pitfalls in multi-asset backtesting are data leakage, look-ahead bias, and survivorship bias.
- Data leakage happens when future information accidentally slips into past calculations, creating an unrealistic advantage.
- Look-ahead bias assumes access to future data, which artificially boosts performance metrics.
- Survivorship bias distorts results by ignoring assets that have failed or been delisted, making the dataset unrepresentative.
These mistakes can seriously compromise the accuracy of backtests, particularly in multi-asset environments where maintaining data integrity is crucial.
Which costs should I include so results match live trading?
To make backtest results align more closely with live trading, it's crucial to include all the costs that influence actual performance. These costs usually consist of trading fees, slippage, and transaction-related expenses like commissions or spreads. Beyond these, you should also consider the market impact and realistic execution factors, such as delays in order fills. By accounting for these elements, your backtesting can provide a simulation that better reflects real trading conditions.