5 Steps to Stress Test Trading Bots

5 Steps to Stress Test Trading Bots
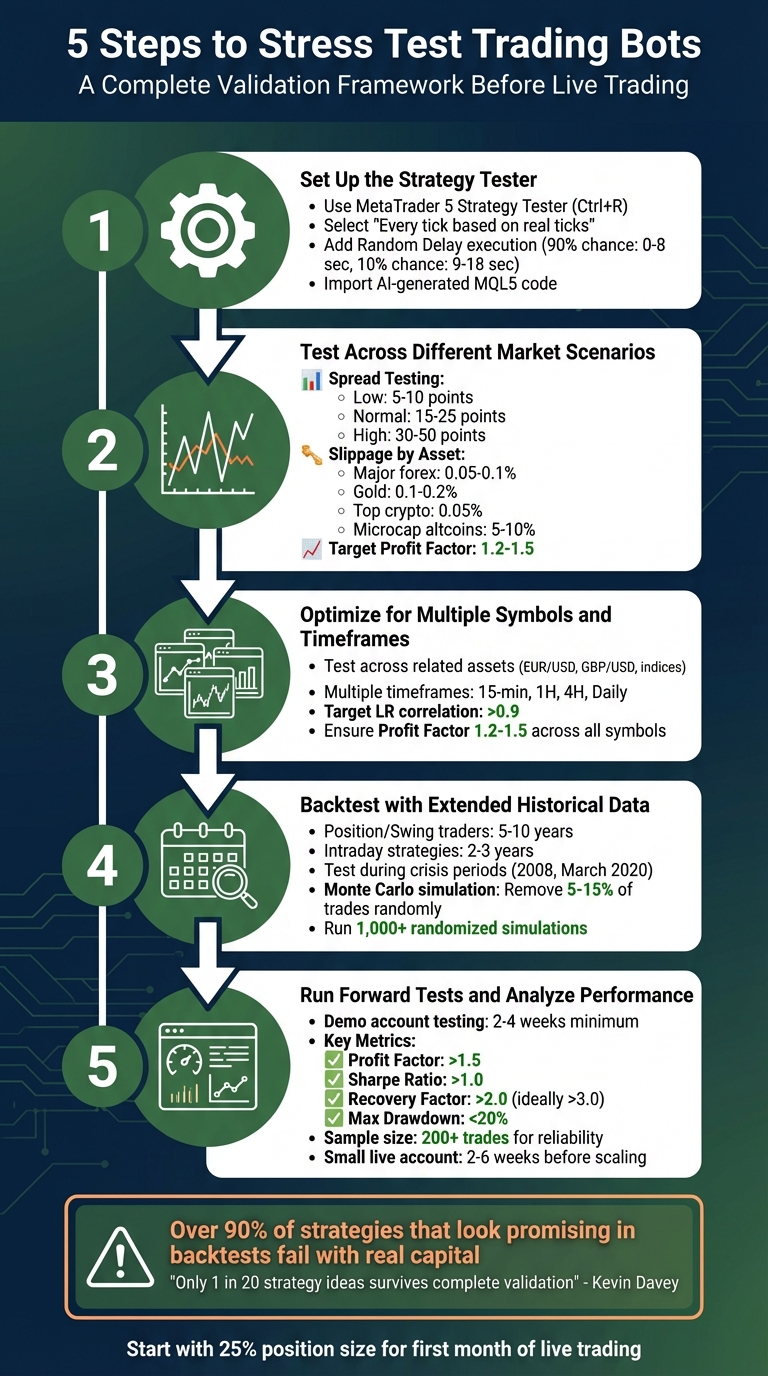
Stress testing trading bots is key to ensuring they perform effectively in unpredictable markets. Without proper testing, even the most promising strategies can fail when exposed to execution delays, volatile spreads, and unexpected market conditions. Here's a quick breakdown of how to prepare your trading bot for live trading:
- Simulate Real Market Conditions: Use tools like MetaTrader 5 to test with real tick data, execution delays, and varying spreads.
- Test in Diverse Scenarios: Evaluate performance across different assets, timeframes, and volatile periods to expose potential weaknesses.
- Backtest with Long-Term Data: Analyze performance over years of historical data to ensure resilience during market crashes and shifts.
- Forward Testing: Run your bot in demo accounts to observe how it handles live-like conditions, including slippage and latency.
- Analyze Metrics: Focus on profit factor, drawdown, and Sharpe ratio to validate reliability before risking real capital.
5-Step Trading Bot Stress Testing Process with Key Metrics
How To Stress Test ANY cTrader Robot Using Free Monte Carlo Simulation Tool
sbb-itb-3b27815
Step 1: Set Up the Strategy Tester
To get started with MetaTrader 5's Strategy Tester, press Ctrl+R or find it under the "View" menu. Once open, head to the Overview tab and select "Stress & Delays" to simulate challenging market conditions. This will help ensure your tests reflect real-world trading scenarios.
Choose the Tick Generation Method
For accurate stress testing, select "Every tick based on real ticks" as your tick generation method. This option uses actual historical tick data from your broker, capturing real market volatility instead of relying on synthetic price movements. While this mode takes more time, it’s crucial for strategies that depend on precise price action, like scalping or high-frequency trading. If your strategy doesn’t rely heavily on such precision, you can opt for "Every tick" to speed up the process. However, always cross-check results with real tick data for a clearer picture.
Add Execution Delays
In live markets, trades aren’t executed instantly due to factors like network latency, broker processing times, or requotes. To replicate these conditions, go to the Settings tab in the Strategy Tester and locate the Execution field. From the dropdown menu, select "Random Delay". This setting introduces realistic timing delays between trade requests and executions. For example, in "Random Delay" mode, there’s a 90% chance of a delay ranging from 0 to 8 seconds and a 10% chance of a longer delay between 9 and 18 seconds.
Import AI-Generated MQL5 Code
Once the tester is configured and delays are in place, it’s time to import your AI-generated MQL5 code. If you’ve used tools like Traidies to create your code, the process is simple. Open MetaTrader 5, press Ctrl+Shift+D to access the data folder, and navigate to MQL5 > Experts. Drop your .mq5 or .ex5 file into this directory. If you’re using a source file (.mq5), MetaTrader 5 will automatically compile it into an executable (.ex5).
After importing, restart MetaTrader 5 or right-click "Expert Advisors" in the Navigator panel and choose "Refresh" to display your bot in the Strategy Tester’s Settings tab. Before running any tests, click the IDE button to open MetaEditor. Check the Errors tab to ensure the code compiles without issues. This step is crucial to avoid unexpected errors during testing.
Step 2: Test Across Different Market Scenarios
After setting up your Strategy Tester, the next step is to run your bot through a variety of market conditions. This process helps uncover potential weaknesses before they translate into real losses. A strategy that works well in stable markets might fail when spreads widen or liquidity dries up. The objective here is straightforward: identify what could break your bot before the market does. This builds on the foundation from Step 1, tweaking market parameters to expose hidden vulnerabilities.
Adjust Broker-Specific Parameters
Start by modifying the spread settings. Change the spread configuration from "Current" to "Points" to manually control spread levels. Test your bot across three scenarios:
- Low spreads: 5–10 points
- Normal spreads: 15–25 points
- High spreads: 30–50 points
If the profitability of your bot vanishes when spreads increase to just 1/4 of its average gain, this indicates over-fitting.
Next, apply slippage penalties specific to the asset class. For example:
- Major forex pairs: 0.05–0.1% slippage
- Gold (XAU/USD): 0.1–0.2% slippage
- Top-tier cryptocurrencies: 0.05% slippage
- Microcap altcoins: up to 5–10% slippage
To illustrate, in January 2024, a $9 million market order for the "dogwifhat" token lost over $5.7 million to slippage due to a thin order book.
Additionally, configure stop loss (SL) and take profit (TP) levels based on your broker's SYMBOL_TRADE_STOPS_LEVEL and SYMBOL_TRADE_FREEZE_LEVEL. Simulate realistic scenarios by triggering stop losses when the price comes within one point of the SL. This helps mimic stop-loss hunting behavior.
Compare Performance Across Different Scenarios
Once you've fine-tuned these settings, analyze your bot's performance across each scenario. Focus on metrics like the profit factor, maximum drawdown, and total net profit. A strong strategy should maintain a profit factor between 1.2 and 1.5, regardless of the market conditions. For example, if your bot achieves a profit factor of 2.5 under low spreads but drops to 0.8 with high spreads, you've identified a critical issue. These tests mirror real-world conditions, preparing your bot for market volatility.
"The goal isn't finding a profitable backtest, it's finding one that survives pessimistic assumptions." – Olha Svyripa, Tech Journalist, Paybis
Pay close attention to out-of-sample performance. Test your bot on unseen 2025 data. If the Sharpe ratio drops by more than 30–50%, it’s a warning sign of over-fitting. Similarly, check if most of your profits come from a single asset. If 80% of gains are tied to one symbol, your bot may lack diversification and struggle to adapt. Finally, simulate scenarios where your bot wins only 50% of the time. If it becomes unprofitable, it indicates that average gains aren't sufficiently larger than average losses. These rigorous comparisons ensure your strategy can withstand stress and remain effective under challenging market conditions.
Step 3: Optimize for Multiple Symbols and Timeframes
Relying on a single asset or timeframe for testing can be a recipe for failure. A strategy that excels on EUR/USD might completely fall apart on GBP/USD, suggesting it capitalized on a fleeting anomaly rather than a sustainable market edge. By testing your bot across various symbols and timeframes, you can assess whether it’s genuinely effective or just lucky with a specific dataset.
Choose Symbols and Timeframes
Begin by selecting related assets from your Market Watch. For example, pair EUR/USD with GBP/USD or S&P 500 futures with Nasdaq. Test your strategy across multiple time intervals - such as 15-minute, hourly, 4-hour, and daily charts - to ensure its performance isn’t tied to a specific bar size. Go a step further by including a mix of asset classes, like forex pairs, metals, and indices, to evaluate its consistency.
A strong strategy should deliver comparable results across neighboring timeframes. If your bot only performs well on one timeframe, it could be a sign of overfitting to that specific data. Testing across multiple assets and timeframes also helps simulate how your bot might operate under unpredictable market conditions.
Measure Performance During Volatility
After expanding your testing scope, focus on how your bot behaves in volatile markets. Use historical data from turbulent periods, such as the 2008 financial crisis or the March 2020 market crash, to gauge its resilience. These stress tests will reveal whether your strategy can handle rapid, unexpected price swings.
Pay special attention to the Linear Regression (LR) correlation of your equity curve. A value over 0.9 indicates steady returns throughout the test period. Additionally, ensure that profits are evenly distributed across assets and that your Profit Factor stays between 1.2 and 1.5 for all tested symbols and timeframes. If it dips below 1.2 for any asset, trading costs in live markets could erode your edge.
"Only 1 out of every 20 strategy ideas survives a complete validation process to reach live trading." – Kevin Davey, World Cup Trading Championship Winner
This multi-symbol, multi-timeframe testing approach not only helps confirm profitability but also strengthens the statistical reliability of your bot. Tools like Traidies (https://traidies.com) can automate these tests, streamlining the process of refining and validating your strategies. By ensuring your bot’s durability now, you’ll be better prepared for extended backtests and live trading in the next stages.
Step 4: Backtest with Extended Historical Data
Once you've tackled simulating volatile conditions, it's time to take things further. Extended backtesting is all about testing your bot's performance over a long stretch of market history. Why? Because a bot that shines over six months might crumble when faced with the ups and downs of a decade. Short testing periods often miss rare but critical events - like the 2008 financial crisis or the March 2020 COVID-19 crash - that could expose weaknesses in your strategy. By backtesting across multiple market cycles, you ensure your bot is tested under all kinds of conditions: bull markets, bear markets, and those frustrating sideways trends.
Extend Backtesting Periods
How far back you should test depends on your trading style. For position and swing traders, aim for 5–10 years of historical data. If you're working with intraday strategies, 2–3 years is typically sufficient. This ensures your bot encounters a wide range of market conditions, not just the ones that make it look good. For instance, a strategy that worked during the low-volatility environment of 2020 might completely fall apart when faced with the high-volatility chaos of 2022.
To take it a step further, focus on testing your bot during specific crisis periods. For example, how would it have performed during the 2008 credit crisis or during flash crash events? These scenarios can reveal whether your bot's strategy gracefully adapts or falls apart under pressure. You can even simulate heightened volatility by doubling historical price swings to mimic fear-driven markets. This helps test whether your bot's risk management measures - like stop-losses and position sizing - can handle extreme conditions.
"Backtesting often overfits to prevailing market regimes and provides little insight into how a strategy performs in crisis conditions where returns and volatility distributions behave differently." – PyQuantLab
By running these rigorous tests, you'll gain a clearer picture of how your bot might fare in real-world trading environments.
Simulate Data Gaps
Live trading isn't as clean as backtesting data. In reality, you’ll face platform outages, connectivity hiccups, and execution delays - problems that pristine historical data can’t replicate. To test how your bot handles these imperfections, try Monte Carlo trade skipping. This method randomly removes 5–15% of trades from your backtest, simulating missed entry points or execution failures during market gaps.
The results can be eye-opening. Research shows that a strategy with a 9.97% drawdown in a traditional backtest could experience a drawdown of over 26% - a whopping 163% increase in risk - when subjected to Monte Carlo stress testing. To ensure your bot's performance isn't just a lucky break, run at least 1,000 randomized simulations. Tools like Traidies (https://traidies.com) make this process easier by automating backtesting with historical data, allowing you to focus on analyzing the results.
Step 5: Run Forward Tests and Analyze Performance
Forward testing takes the insights from backtesting and applies them to a live-like environment, exposing your bot to the practical challenges of real-world execution. While backtesting focuses on historical performance, forward testing highlights how your strategy handles live market conditions. This step is crucial because even a strategy that excelled in backtests can falter when factors like slippage, latency, or broker execution issues come into play. As the SmartT Research Team emphasizes:
"A profitable backtest does NOT mean an EA is ready for live trading. Only forward-testing on demo reveals real execution behavior".
To get started, run your bot on a demo account that closely mirrors your planned live setup. This includes using the same broker, leverage, account type (e.g., ECN, Raw, or Standard), and starting balance. This setup helps identify execution issues such as duplicate trades, terminal errors, rejected orders, or mishandled gaps. Run these tests for at least 2–4 weeks to capture different market conditions. One critical rule here: avoid tweaking parameters during the test. Adjusting settings mid-test resets your data and compromises the consistency of your results.
Review Key Performance Metrics
During forward testing, focus on specific performance metrics to gauge your bot's effectiveness. Look for benchmarks like a Profit Factor above 1.5, a Sharpe Ratio over 1.0, a Recovery Factor greater than 2.0 (ideally 3.0), and a Maximum Drawdown below 20%. These metrics help differentiate a reliable strategy from one that succeeded by chance.
| Metric | Target Benchmark | What It Reveals |
|---|---|---|
| Profit Factor | > 1.5 | Measures profitability relative to losses |
| Sharpe Ratio | > 1.0 | Evaluates risk-adjusted returns |
| Recovery Factor | > 2.0 (ideally > 3.0) | Tracks recovery speed from drawdowns |
| Max Drawdown | < 20% | Assesses risk of peak-to-trough decline |
Additionally, ensure you have a sufficient sample size for reliable insights. If you have fewer than 30 trades, your data may lack reliability. A range of 50–100 trades starts to reveal patterns, while 200+ trades provides a solid foundation for decision-making. Keep an eye on execution metrics like slippage, average entry spread, and trade frequency, as these directly affect live performance.
Refine Strategies with Customizable Expert Advisors
Forward testing isn't just about validation - it’s an opportunity to refine your strategy. Customizable Expert Advisors (EAs) allow you to adapt your bot’s behavior based on observed performance. For instance, if stop-losses are triggered too often, consider tightening position sizes. If market volatility generates false signals, you can implement filters like "AI Guard" features that pause trading during unpredictable conditions. Platforms like Traidies (https://traidies.com) simplify this process by offering AI-powered tools to create and adjust MQL5 code, enabling you to make precise changes without starting from scratch.
Patience is key here - wait until you’ve gathered enough data before making adjustments. Flora Rosa Seeholzer, a seasoned trader, offers this insight:
"The correct goal is NOT 'demo must match live exactly.' The correct goal is: demo confirms behavior, small live confirms execution reality, time confirms stability".
Once your demo results are consistent, transition to a small live account for 2–6 weeks. This step confirms whether your bot’s execution is stable in real market conditions. Only after this phase should you consider scaling up, ensuring your strategy is robust across various market environments.
Conclusion
Stress testing is what separates a reliable trading strategy from one that falters under volatile market conditions. The five-step process we’ve discussed - creating realistic test environments, running diverse market scenarios, validating across multiple symbols and timeframes, backtesting with extensive historical data, and performing forward tests - lays the groundwork for building a durable automated system. Each step tackles specific blind spots that traditional backtests often overlook, such as execution delays, slippage, market regime changes, and rare but impactful events.
Here’s a staggering reality: over 90% of trading strategies that look promising in backtests fail when deployed with real capital, and only 1 in 20 strategy ideas typically passes professional validation to make it to live trading. This highlights just how crucial stress testing is. As Ernest Chan, author of Algorithmic Trading, wisely puts it:
"No matter how good your backtest is, the first contact with the real market always reveals differences".
Platforms like Traidies (https://traidies.com) can simplify this process. Their AI-driven tools can convert natural language descriptions into MQL5 code and automate backtesting with historical data. This not only speeds up strategy refinement but also ensures your system undergoes rigorous robustness checks, such as Monte Carlo simulations, walk-forward testing, and parameter sensitivity analysis.
Adopt a cautious approach when transitioning to live trading. Simulate real-world conditions by doubling historical spreads and introducing 100–200ms latency to account for market delays. Begin live trading with just 25% of your intended position size for the first month to verify that your real-world performance mirrors your test results. Following this disciplined testing framework safeguards your capital and equips you to handle market turbulence, ensuring your trading bot remains operational even during challenging periods.
FAQs
How do I know my bot isn’t overfit?
To ensure your trading bot isn’t overfit, it’s essential to run robustness tests and validate its performance on unseen data. This means going beyond just testing it on the data it was trained on. Check how sensitive the bot is to parameter changes and observe how it performs under different market conditions.
Make it a habit to use out-of-sample data - data the bot hasn’t encountered during training. Techniques like early stopping and regularization can help prevent the bot from simply memorizing historical patterns. Additionally, test the bot across a range of market regimes (e.g., bullish, bearish, and sideways markets) to confirm that it can adapt and perform consistently. This approach ensures the bot generalizes well rather than just excelling in familiar scenarios.
How long should I forward test before going live?
The length of forward testing varies based on how often you trade and the market environment. The goal is to collect a reliable sample size while monitoring critical metrics such as expectancy, drawdown, and profit factor. Make sure your testing process is methodical - stick to fixed rules, maintain controlled conditions, and log every trade. Keep testing until you’ve gathered enough data to confidently assess the strategy’s reliability and performance before moving to live trading.
What slippage and spread assumptions are realistic?
When setting up realistic assumptions for slippage and spreads, it's essential to factor in market volatility and potential execution delays. Slippage, which is the gap between the price you expect and the price you actually get, tends to be larger during periods of high market activity.
For spreads, consider simulating broader values - like doubling the average spread - to reflect more challenging trading conditions. Additionally, account for execution delays, such as 100-200ms latency, which can significantly impact performance during fast-moving markets. These adjustments prepare your trading bot to operate more reliably in unpredictable scenarios.