Preprocessing Forex Data for MT5 Backtesting

Preprocessing Forex Data for MT5 Backtesting
When backtesting forex strategies in MetaTrader 5 (MT5), the accuracy of your results depends heavily on the quality of your historical data. Many raw datasets contain issues like gaps, duplicate entries, or mismatched timezones, which can distort your testing outcomes. Proper preprocessing ensures your strategy's performance is evaluated reliably.
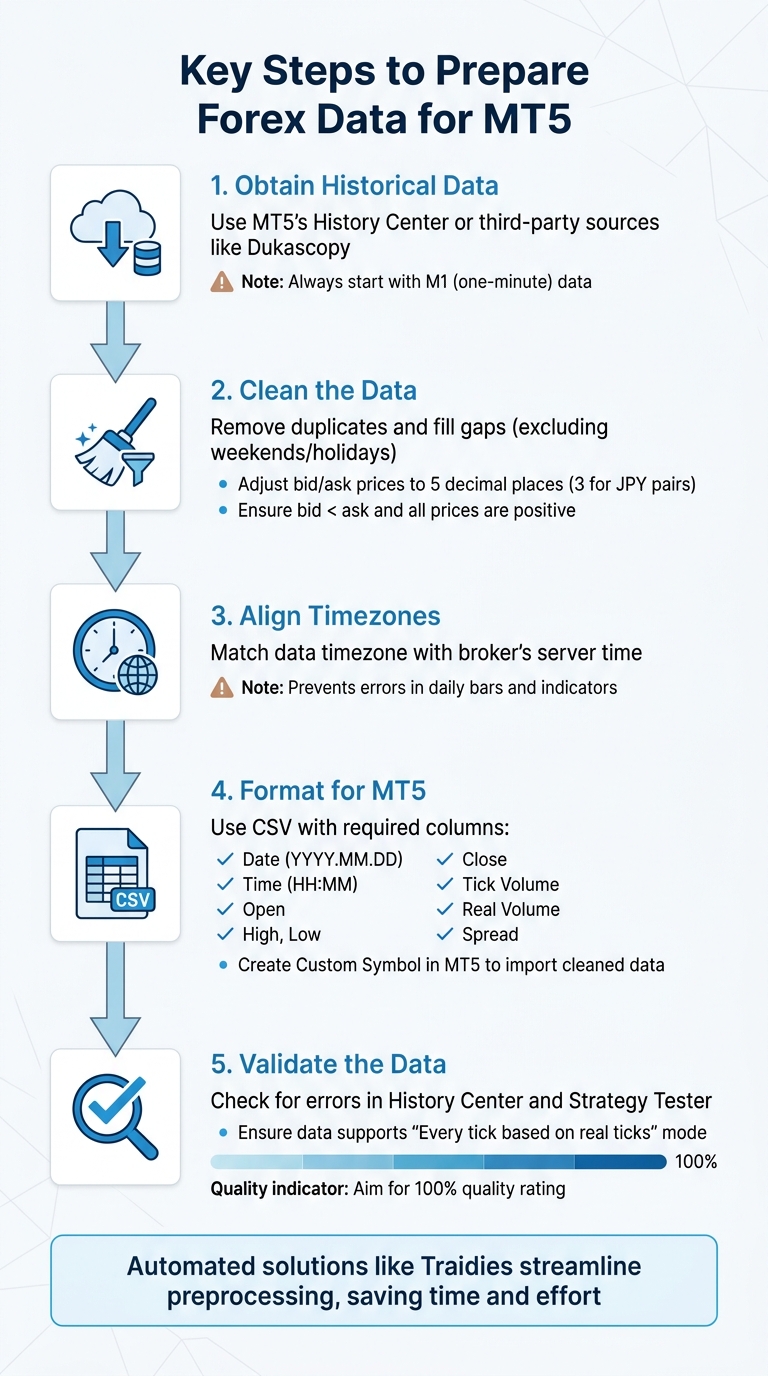
Key Steps to Prepare Forex Data for MT5:
- Obtain Historical Data: Use MT5's History Center or third-party sources like Dukascopy.
- Clean the Data:
- Remove duplicates and fill gaps (excluding weekends/holidays).
- Adjust bid/ask prices and ensure correct formatting (e.g., five decimal places for most currency pairs).
- Align Timezones: Match the data's timezone with your broker's server time to avoid errors in daily bars and indicators.
- Format for MT5:
- Use CSV files with required columns: Date, Time, Open, High, Low, Close, Tick Volume, Real Volume, Spread.
- Create a Custom Symbol in MT5 to import and use your cleaned data.
- Validate the Data:
- Check for errors in MT5's History Center and Strategy Tester.
- Ensure the data supports "Every tick based on real ticks" mode for accurate backtesting.
Simplified Tools:
Automated solutions like Traidies streamline preprocessing, aligning data formats, timezones, and even running backtests, saving time and effort.
Accurate preprocessing is essential for reliable backtesting, as flawed data can lead to misleading results. Whether manual or automated, ensure your data is clean, properly formatted, and aligned for MT5.
5-Step Forex Data Preprocessing Workflow for MT5 Backtesting
The Backtest Reality Check Every MT5 Trader Needs to See
sbb-itb-3b27815
Getting Historical Forex Data for MT5
Before diving into preprocessing, you’ll need to get historical data in MT5. The platform offers two main methods for this: using its built-in graphical tools or leveraging MQL5 scripts for automated data export. The choice depends on your workflow and technical expertise.
Using MT5's Built-in Tools
MT5 provides two key interfaces for accessing and managing historical data:
-
History Center: Access this by pressing F2 or navigating to
Tools > History Center. It allows you to view, download, and edit bar data for any symbol listed in your Market Watch. This is a quick way to pull standard broker-provided data. -
Symbols Dialog: Open this by pressing Ctrl+U or going to
View > Symbols. This is the main hub for managing symbols and requesting specific date ranges for both bar and tick data. You can also export data directly to CSV format here. If you need to import third-party data (e.g., from Dukascopy or HistData.com), use the "Create Custom Symbol" option since MT5 doesn’t let you overwrite broker-provided data.
When downloading, always start with M1 (one-minute) data. MT5 uses M1 bars or ticks as the foundation for all higher timeframes. Missing M1 data will create gaps in every other timeframe. Exporting to CSV is recommended for compatibility with tools like Python, Excel, or other preprocessing software.
If you encounter a "limited by charts settings" error, adjust the "Max bars in chart" setting under Tools > Options > Charts to ensure you’re capturing the full historical range.
Exporting Data with MQL5 Functions
For those who prefer automation or need frequent data exports, MQL5 scripts offer a more programmatic solution. The CopyRates() function can pull historical OHLCV (Open, High, Low, Close, Volume) data into an array. You can then save this data to a CSV file using MQL5 file operations like FileOpen(), FileWrite(), and FileClose(). The exported files are stored in the MQL5/Files directory within your MT5 data folder.
To create and execute these scripts, open MetaEditor from MT5’s Tools menu. However, ensure you’ve downloaded the broker’s historical data via the History Center beforehand - otherwise, your exported files will have gaps.
Keep in mind the storage requirements: M1 bar data for a single forex pair spanning 10 years takes up about 200–400 MB of uncompressed disk space. Tick data, however, is much heavier; a single year can consume several gigabytes. If you’re working with multiple currency pairs, plan your storage carefully.
Once you’ve secured your historical data, the next step is to clean and validate it for further analysis.
Cleaning and Validating Raw Forex Data
Once you've got your raw forex data, the next step is to clean and validate it for accurate backtesting. Even if the data comes from a trusted broker or third-party source, issues like duplicate timestamps, missing bars, or mismatched timezones can throw off your results. As Daniel Fernandez, Founder of Mechanical Forex, emphasizes:
"A clean data set must contain zero duplicate bars".
Before converting your data into MT5-compatible formats, it’s essential to ensure it’s free of errors.
Removing Duplicates and Filling Data Gaps
Start by confirming that each bar in your dataset has a unique timestamp. Duplicates can arise when combining data from multiple sources or when millisecond differences are lost during M1 bar creation. If you're using Python with Pandas, you can easily spot duplicates by loading your CSV into a DataFrame, setting the 'time' column as the index, and running df.index.duplicated(). Eliminate duplicates with df = df[~df.index.duplicated(keep='last')] and then sort the data chronologically using df.sort_index().
Accuracy also depends on rounding bid and ask prices correctly - five decimal places for most currency pairs and three for JPY pairs. Make sure bid and ask prices are always positive, with the ask price higher than the bid. While cleaning, avoid filling gaps that occur during natural market closures like weekends or major holidays (e.g., Christmas and New Year’s Day). For gaps during active trading hours, use forward-filling (ffill) to carry the last valid price forward until new data is available.
Adjusting Timezones
Timezone alignment is crucial because server times directly impact candle open/close times. A daily candle might close at different hours depending on whether the server operates on GMT or New York time, which can alter OHLC values. This misalignment can affect your technical indicators, strategy synchronization, and even how economic news impacts the market. To ensure consistency, check that your broker’s server time matches your data’s timezone.
To adjust timezones, first identify your broker’s server time. You can find this on their website or by comparing the "Market Watch" time in MT5 to the current UTC time. If you’re importing CSV files manually into MT5, use the "Shift" parameter to adjust the data by the necessary number of hours. For Python users, the pytz library is a great tool for standardizing timestamps to UTC, avoiding issues caused by local system time offsets. Many traders prefer aligning data to the "New York close" (EST+7 or UTC+2/3) for consistent five-day weekly charts without "Sunday candles".
Using Python for Data Cleaning
Python, particularly Pandas, is highly effective for cleaning forex data. Load your CSV file with pd.read_csv(), then convert the 'time' column to a datetime index using pd.to_datetime() with the correct unit (e.g., unit='s' for Unix timestamps). This makes it easy to filter out invalid data, apply timezone adjustments with tz_localize('UTC'), and remove rows with missing values using dropna(). Once cleaned, export the data back to CSV in the required format: Date (YYYY.MM.DD), Time (HH:MM), Open, High, Low, Close, Tick Volume, and Spread. Since MT5 doesn't allow overwriting broker-provided data, you’ll need to create a "Custom Symbol" to host your cleaned dataset.
With your data cleaned and validated, you’re ready to move on to converting it into MT5-compatible formats.
Converting Data to MT5-Compatible Formats
Once your data is clean and error-free, it’s time to convert it into formats that work with MT5. Unlike MT4, which uses .hst and .fxt files, MT5 relies on .hc files for bars and .hcc files for ticks. MT5 also supports importing data via CSV files, which is often the simplest option for many traders. To prevent MT5 from overwriting your imported data with your broker’s server history, you’ll need to create a Custom Symbol. These steps ensure your data is ready for effective backtesting in MT5.
Creating .hc and .hcc Files
If you’re working with external tick data, such as data from Dukascopy, you’ll need to convert it into MT5-compatible formats. Tools like Tick Data Suite, Tickstory, and QuantDataManager can handle this task, turning CSV files into the .hc and .hcc formats MT5 requires. Using these tools allows for "Every tick based on real ticks" backtesting with a 100% quality rating when precise tick data is imported. By comparison, MT4 typically caps at 90% quality unless you use additional customizations.
For most traders, importing M1 (one-minute) bar data via CSV is sufficient. MT5 automatically calculates higher timeframes (like M5, H1, and D1) from the M1 data. To ensure your dataset processes correctly, set "Max bars in chart" to "Unlimited" in MT5. When preparing your CSV file, follow MT5’s specific format requirements:
- Date: YYYY.MM.DD
- Time: HH:MM (24-hour format)
- Decimal Separator: Use a period (.)
- Columns: Date, Time, Open, High, Low, Close, Tick Volume, Real Volume, Spread.
Aligning Bars and Adjusting Volume
Once your data is cleaned, you’ll need to align bars and fine-tune volume details for accurate integration into MT5. Timezone alignment is critical here. For example, if your source data is in GMT but your broker’s server operates on GMT+2, you’ll need to shift timestamps during the import process to avoid issues with daily and weekly bar alignment. MT5 provides a "Shift" parameter in its import dialog, allowing you to adjust the data by the required number of hours. For instance, if your data is in GMT+0 and your broker uses GMT+2, apply a +2-hour shift to keep everything aligned. Misaligned timestamps can disrupt OHLC values and technical indicators.
Forex data often uses Tick Volume (which reflects the number of price changes) since Real Volume is frequently set to 0. When importing, make sure to check the "Tick volumes" box if your dataset includes this information. If your source data doesn’t include volume or spread details, use "0" as a placeholder to maintain the required structure. After importing, switch to the M1 timeframe in MT5 and visually inspect the data for flat sections or unusual price spikes, which could signal formatting errors. Once everything is aligned and volume-adjusted, your data is ready for backtesting in MT5.
Loading Preprocessed Data into MT5
Once your data is converted and aligned, the next step is to load it into MT5 and ensure everything is working as it should. MT5 uses its own .hcc file format, but you can import data in .csv or .hst formats through its built-in tools. The trick here is to use Custom Symbols to prevent your broker's server from overwriting your carefully prepared dataset.
Placing Files in the Correct MT5 Folders
Start by placing your preprocessed files in the MQL5\Files folder. You can find this folder by navigating to File > Open Data Folder in MT5. Next, go to Tools > Options > Charts and set "Max bars in chart" to Unlimited. After making this change, restart MT5 to ensure it takes effect.
Now, open the Symbols window by pressing Ctrl+U and create a Custom Symbol. This step is crucial to avoid conflicts with your broker's native data. Select your Custom Symbol, then go to the Bars tab and click Import Bars. Use the Browse button to locate your file in the MQL5\Files folder. During this process, make sure the Shift parameter matches your broker's timezone. After the import is complete, refresh your chart to load the new data. At this point, you’re ready to verify the data’s accuracy using MT5's Strategy Tester.
Checking Preprocessed Data in Strategy Tester
Ensuring your data is accurate is critical for reliable backtesting. Start by opening a chart for your imported Custom Symbol and switching to the M1 timeframe (shortcut: Alt+1). Carefully scroll through the data, keeping an eye out for flat sections, unusual price spikes, or any major errors that might indicate formatting issues. Then, switch to higher timeframes like H1 or D1 to confirm that MT5 has correctly calculated these from your M1 data.
To dig deeper, press F2 to open the History Center. Here, you can verify that the date range and bar count match your imported file. For a final check, use the Strategy Tester (Ctrl+R) and choose "Every tick based on real ticks" as the modeling mode. After running a test, look at the "Quality" percentage in the report - tick data of the highest quality should show 100%. If you spot any issues, compare specific bars in the History Center with your original CSV or source file to ensure the prices and timestamps match exactly.
Using Traidies for Automated Preprocessing

Preprocessing forex data for MT5 can be a time-consuming process - especially when dealing with tricky details like CSV formatting, timezone adjustments, and custom symbol imports. Traidies takes over these repetitive tasks, simplifying your workflow so you can concentrate on creating and refining your trading strategies.
Traidies' AI-Powered Tools for Data Preprocessing
Traidies makes formatting historical data for MT5 a breeze. By aligning with MT5's data structure, it ensures that your M1 data is properly formatted to meet platform requirements. Thanks to its AI-driven tools, Traidies connects directly to MT5, skipping the need for manual file placement or the hassle of setting up custom symbols to handle external data.
Automated Backtesting and Strategy Optimization
Traidies doesn't just stop at data preparation - it goes a step further by running automated backtests on your cleaned data. You can describe your trading strategy in plain English, and Traidies will convert it into MQL5 code, ready for testing. This seamless integration provides you with clean data and instant feedback on how your strategy performs in real-market conditions. It also ensures volume alignment and runs backtests in the "Every tick based on real ticks" mode, which is ideal for short-term and scalping strategies. By automating both preprocessing and backtesting, Traidies minimizes errors and speeds up the entire strategy development process.
Conclusion
Preparing forex data for MT5 backtesting is a critical step - it lays the groundwork for accurate strategy evaluation. The quality of your M1 data is the backbone for all higher timeframes, from M5 to daily charts. If your data isn't properly formatted, aligned to the correct timezone, or free of gaps, your backtest results may end up reflecting data flaws instead of your strategy's actual performance.
Taking the manual route can be time-consuming and requires technical know-how. Tasks like downloading CSV files, adjusting GMT offsets, creating custom symbols, and ensuring the historical data is reliable all demand precision and a significant investment of effort.
This is where tools like Traidies step in to simplify the process. It automates data synchronization, handles formatting, aligns timezones, and validates data quality. Plus, it supports backtesting in the "Every tick based on real ticks" mode - widely regarded as the most accurate option for short-term strategies. By turning plain English instructions into tested MQL5 code, it transforms weeks of manual work into just a few minutes, giving you more time to refine your trading strategies.
Ultimately, whether you opt for manual preprocessing or automated solutions, the success of your backtesting hinges on the quality and integrity of your M1 data. Accurate data is the cornerstone of reliable backtest results.
FAQs
How do I find my broker’s MT5 server timezone?
To determine your broker's MT5 server timezone, start by looking at the server time displayed in the MT5 platform. This is typically visible in the Market Watch window or in the server time display area. If you're unsure, you can always reach out to your broker directly or check their documentation for precise timezone information. Keep in mind that the server time is controlled by the broker and only updates when market ticks occur, meaning it may temporarily pause during periods of inactivity.
When should I fix missing bars versus leaving weekend gaps?
When dealing with missing bars, it's essential to address gaps that could impact backtesting accuracy, such as those caused by low liquidity or data corruption. These gaps can lead to misleading results if not handled properly. However, if the gaps occur over weekends and align with market closures - and your strategy doesn't trade during weekends - it's better to leave them as they are.
Fixing missing bars enhances data continuity for accurate analysis, but leaving weekend gaps untouched avoids unnecessary adjustments that wouldn't affect your strategy's performance.
Do I need tick data, or is M1 data enough for my backtest?
When it comes to MT5 backtesting, tick data is your best bet for the most accurate simulations. It captures every price movement, making it perfect for detailed strategy evaluations and ensuring 100% history quality. On the other hand, M1 data might work for broader analysis or simpler tests, but it doesn’t provide the same level of detail as tick-by-tick data. If precision matters, stick with tick data for dependable results.