How Risk-Aware Algorithms Improve Leverage

How Risk-Aware Algorithms Improve Leverage
Leverage can boost profits but also magnify losses. Risk-aware algorithms help traders manage leverage dynamically, reducing exposure during volatile markets and increasing it when conditions are stable. By using tools like volatility targeting, Value at Risk (VaR), and Conditional Value at Risk (CVaR), these systems aim to balance risk and reward effectively.
Key Takeaways:
- Leverage Basics: Amplifies gains but increases risk. Mismanagement can lead to significant losses.
- Dynamic Adjustments: Algorithms adjust leverage based on real-time metrics like market volatility.
- Risk Metrics: Tools like ATR, margin level, and CVaR guide position sizing and safeguard capital.
- Position Sizing: Use formulas to limit risk per trade (e.g., 1–2% of account equity).
- Automation: AI tools and platforms like Traidies can generate code for risk-based trading systems.
By integrating these principles into trading strategies, you can better manage risks and improve long-term outcomes.
Foundations of Risk-Aware Execution
Key Risk Metrics in Trading
To manage leverage effectively, algorithms need to monitor a few critical metrics: account equity, margin level, and free margin. These metrics help determine whether it’s safe to open new positions or if the system is nearing risky territory. Among these, margin level acts as an early warning system. If it drops too low, brokers can step in and automatically close positions to prevent further losses.
Another crucial aspect is tracking volatility measures. The Average True Range (ATR) is widely used to gauge daily market fluctuations. A higher ATR indicates larger price swings, which directly influences position sizing. Alongside ATR, the per-trade risk percentage is vital. Most traders cap this at 1–2% of account equity per trade to ensure that no single loss becomes catastrophic. For leverage, professionals often stick to a range of 1x to 5x, favoring long-term stability over quick profits.
"In professional algo trading, risk management is the foundation that signal logic sits on top of." - Bhavin Javia, Founder, BotJockie
Mapping Trading Rules to Risk Parameters
Once these metrics are identified, they should be translated into actionable rules for position sizing. A common method is fixed fractional sizing, which uses the formula: (Account Equity × Risk Percentage) ÷ Stop-Loss Distance. This ensures that position sizes adapt to account size and risk tolerance.
For instance, if your stop-loss is set at 2× ATR, the system adjusts position sizing automatically to account for changing market conditions. Advanced systems can go a step further by incorporating Conditional Value at Risk (CVaR), which adjusts leverage based on the average loss in the worst 5% of historical scenarios. Additionally, if a drawdown exceeds 20%, leverage should be minimized to its lowest setting.
Adding Risk Logic to Trading Systems
Risk management doesn’t stop with position sizing - it needs to be embedded into every stage of the trading process. Start with a "trading allowed" gate: before executing any entry signal, the system should check if daily loss limits or maximum drawdown thresholds have been breached. If limits are exceeded, no new trades are initiated.
Once a trade is live, continuous monitoring is essential. The system should track slippage, spread changes, and volatility shifts that might alter the trade’s risk profile. A three-phase stop management strategy can help here:
- Begin with an ATR-based initial stop.
- Move to breakeven once the trade achieves a 1R profit.
- Apply a trailing stop at 2R profit.
This phased approach ensures risk is managed at every step without constant manual adjustments. Combined with dynamic leverage controls, these safeguards enhance the system’s overall reliability.
| Risk Layer | Key Indicators | Response |
|---|---|---|
| Market & Liquidity | ATR, Spread, Order Book Depth | Reduce position size or hold off trades |
| Strategy & Model | Expectancy, Win/Loss Ratio, VaR | Pause signals and re-evaluate models |
| Execution & Platform | Slippage, Latency, API Error Rate | Close positions or switch platforms |
| Portfolio & Exposure | Net Exposure, Margin Level, Correlation | Hedge or lower exposure |
sbb-itb-3b27815
Implementing Risk-Based Position Sizing
Volatility-Adjusted Position Sizing: High vs. Low Volatility
Calculating Position Size from Risk
To calculate your position size, start by determining the dollar amount you're willing to risk. Multiply your account equity by your chosen risk percentage. For example, if you have a $10,000 account and decide to risk 1% per trade, that means you're risking $100. Then, divide this dollar risk by the stop-loss distance in dollars per lot.
The formula looks like this: Lot Size = (Account Equity × Risk %) ÷ Stop-Loss Distance in $/lot. For instance, with a stop-loss distance of $200 per lot, your position size would be 0.5 lots. It's important to remember that leverage offered by your broker affects margin requirements but doesn't impact the actual risk per trade. Always round down to the nearest valid lot size and ensure you're within your broker's maximum volume limits. Adjust these calculations regularly, especially as market volatility changes.
"Proper lot sizing ensures that potential losses are kept within acceptable limits relative to the account equity. It's the cornerstone of sound money management." - Trading Strategies Academy
Volatility-Adjusted Sizing
Using a fixed pip stop-loss can backfire when market conditions shift. Volatility spikes, for instance, can easily trigger stop-losses that might have been safe in calmer markets. To address this, many traders use ATR-based stops, which adapt to changing volatility and help maintain consistent risk levels.
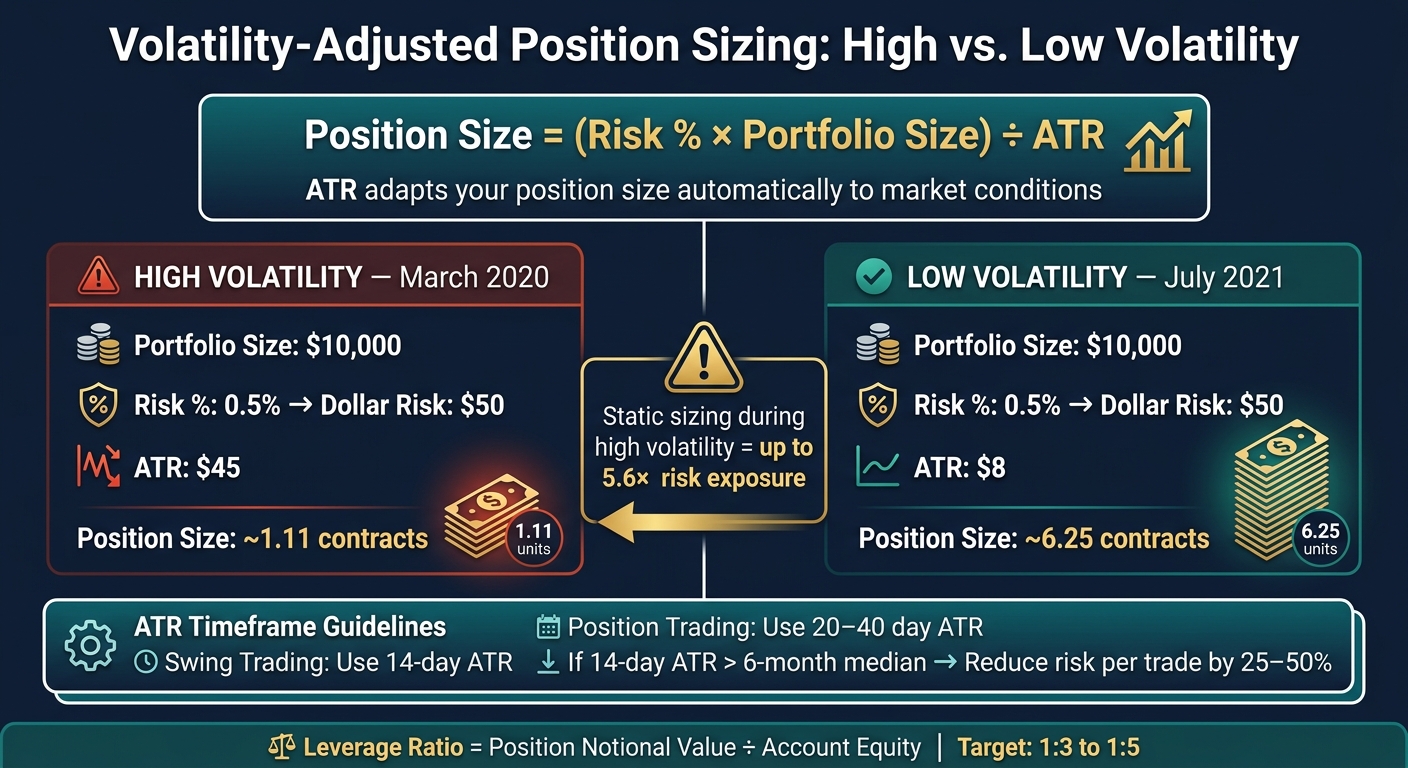
The formula for volatility-adjusted sizing is: Position Size = (Risk % × Portfolio Size) ÷ ATR. Higher volatility, indicated by a larger ATR, reduces position size, while lower volatility allows for larger positions. For example, during the high-volatility period in March 2020, when the ATR was $45, a $10,000 portfolio risking 0.5% ($50) could handle a position size of about 1.11 contracts. In contrast, during the low-volatility period of July 2021, with an ATR of $8, the same $50 risk allowed for approximately 6.25 contracts. Sticking to a static position size during volatile times could have exposed you to significantly higher risks - up to 5.6 times more in this example.
When choosing a timeframe for ATR, consider using a 14-day ATR for swing trading and a 20–40 day ATR for position trading. If the 14-day ATR exceeds its 6-month median, you might want to reduce your risk per trade by 25–50%.
Setting and Enforcing Leverage Limits
Once your position size is calculated, evaluate the trade's effective leverage. Use this formula to find the leverage ratio: Leverage Ratio = Position Notional Value ÷ Account Equity. For example, if your position has a notional value of $50,000 and your account equity is $10,000, your effective leverage is 5:1. Aim to keep your leverage ratio between 1:3 and 1:5, especially as volatility increases.
Regulatory limits also play a role. In the U.S., the CFTC caps forex leverage at 50:1 for major pairs, while Regulation T limits stock margin to 2:1 for initial purchases. Your trading system should ensure compliance with these rules before executing trades. Beyond these limits, adding safeguards like circuit breakers can help. For instance, you could halt trading if your account drops by 3% in a single day. Reassess your effective leverage after every trade, as changes in account equity will affect your exposure.
"Leverage is neither good nor bad - it's a tool. Calculate it with the simple notional-to-equity formula... and size positions so a single losing trade never costs more than 1% of your account." - Marcus O'Connor, FinTech Engineer
Automating Risk-Aware Leverage with AI Tools
Turning Risk Rules into Code
Once you've set your risk parameters - like stop-loss distances, ATR multipliers, and daily loss limits - the next step is turning those rules into executable code. For example, your Maximum Daily Loss (MDL) becomes a numeric input, while your lot sizing formula - (Account Balance × Risk %) ÷ (Stop-Loss Distance × Pip Value) - is embedded into the OnTick event handler to ensure real-time recalculations. Some advanced systems even include dynamic risk-adjustment logic, where specific equity drawdown points (e.g., 2%, 5%, or 7%) automatically lower the per-trade risk. For instance, the risk might drop from 1% to 0.5% after hitting a certain threshold. These automated mechanisms lay the groundwork for creating a more resilient trading strategy.
Using Traidies for Strategy Development and Testing

Traidies makes this process easier by allowing you to describe your strategy in plain English, including your risk parameters, and then automatically generating MQL5 code. For example, you can input instructions like "use ATR-based stops with a 14-period lookback" or "stop trading if daily drawdown exceeds 3%", and the platform will handle the coding. This efficient translation is key to implementing risk-aware leverage strategies.
Traidies also enables automated backtesting with historical data, giving you a clear view of how your leverage and position-sizing rules would have performed in the past. This is especially helpful for testing features like kill-switch conditions and cooldown timers - elements that are tough to evaluate manually but become obvious during backtesting. Additionally, the platform supports customizable Expert Advisors, so you can tweak the auto-generated code to better suit your needs without starting from scratch.
"Without proper risk management, even the most promising trading system can be wiped out by a series of adverse trades." - Trading Strategies Academy
Refining Strategies Through Backtesting and Forward Testing
Automating risk logic is just the beginning - extensive testing is critical to fine-tune your strategy. As Zhuo Kai Chen, a quant researcher, explains:
"A single backtest represents only one possible arrangement of this series, making its statistical robustness limited."
This is where Monte Carlo simulations come in. These simulations shuffle historical returns to create thousands of possible equity paths, providing a clearer picture of potential drawdowns. A common benchmark is using the 95th percentile of simulated drawdowns to set a maximum tolerance, which often results in a 30% drawdown limit.
Once backtesting is complete, follow up with 30–90 days of paper trading to see how your strategy performs in real-world conditions. This forward-testing phase is crucial - it ensures your risk management logic works in live markets, not just in historical scenarios. If a strategy fails in forward testing, it should be discarded, no matter how impressive the backtest results were. When applying leverage formulas like the Kelly Criterion, consider using a half-Kelly or another fractional approach to account for unexpected market challenges.
Conclusion: Getting Smarter About Leverage Management
Key Takeaways
The main point here is simple: leverage isn’t static - it evolves based on factors like volatility, past drawdowns, and real-time risk metrics. Quant Beckman, a Trading Systems Architect, sums it up perfectly:
"The watershed moment in trading system design comes with the recognition that leverage should be as adaptive and intelligent as the core alpha generation model itself."
The goal of smart leverage management isn’t just figuring out how much leverage you can use - it’s about understanding how much risk your account can handle. This means focusing on measures like Conditional Value at Risk (CVaR) instead of relying solely on standard deviation. It also involves using fractional Kelly sizing (around 0.25x–0.5x) to avoid overextending yourself, and keeping a 20–30% buffer above maintenance margin requirements. Professional traders and top-tier funds often limit leverage to 1x–3x for this exact reason.
Use these principles to fine-tune your approach to risk and leverage.
Next Steps for Traders
Now, let’s talk about applying these ideas. Start by auditing your current trading strategy: Are your position sizes based on solid risk metrics, or are you relying on instinct? If you don’t have automated rules to adjust exposure during high volatility or after hitting drawdown limits, that’s your first priority.
Once you’ve addressed this, tools like Traidies can help you take things further. With Traidies, you can define risk rules in plain English - like ATR-based stops, CVaR thresholds, or daily drawdown caps - and it will generate working MQL5 code for you, no programming required. Combine this with automated backtesting on historical data, and you can test your leverage strategies thoroughly before going live. Start small - validate your system over at least 50 trades at 2x leverage before scaling up.
FAQs
How do I choose an ATR timeframe for my trading style?
The ATR timeframe you choose should match your trading style and the level of volatility you aim to consider. For day traders or those focused on short-term moves, shorter periods like 14 or 20 tend to react more quickly to recent market shifts. On the other hand, swing traders or long-term investors often prefer longer periods, such as 50, as they offer a steadier measure of volatility. The key is to align your timeframe with your specific trading goals and fine-tune it through backtesting and hands-on experience.
When should an algorithm cut leverage after a drawdown?
When managing risk, an algorithm should scale back leverage following a drawdown if certain signals indicate higher risk levels. These signals might include hitting predefined drawdown limits, a spike in market volatility, or noticeable trend reversals. By making these adjustments, the goal is to safeguard capital and prevent deeper losses.
How can I test risk rules before going live?
To ensure your risk rules are solid before diving into live trading, it's crucial to conduct thorough backtesting and simulations with historical data. Using techniques like Monte Carlo simulations can help you assess how your strategies perform under different market scenarios, giving you a clearer picture of potential outcomes.
On top of that, building a risk management module allows you to test key controls - like stop-loss settings and slippage - within a simulated environment. Tools such as Traidies can streamline backtesting, making it easier to fine-tune your risk rules and adjust leverage management before putting them into action.