Ultimate Guide to Trading Model Metrics
Ultimate Guide to Trading Model Metrics
Understanding trading metrics is essential for building and refining successful trading strategies. These metrics go beyond profit figures, revealing the risks, consistency, and reliability of your approach. Key takeaways include:
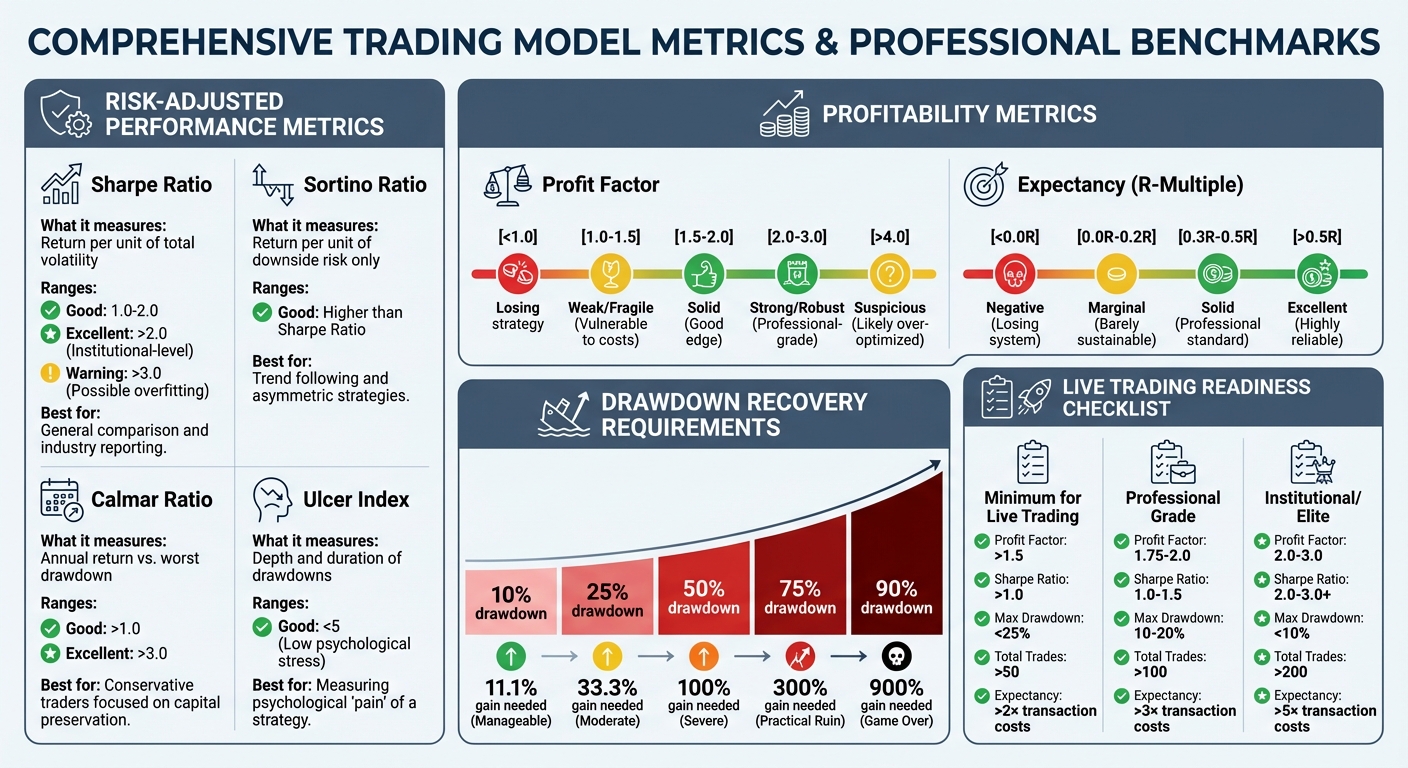
- Risk-Adjusted Metrics: Tools like the Sharpe Ratio and Sortino Ratio help measure returns relative to risk. For example, a Sharpe Ratio above 1.0 is the professional benchmark.
- Drawdown Metrics: Maximum Drawdown (MDD) and Recovery Factor highlight potential losses and the difficulty of recovering from them. A 50% drawdown requires a 100% gain to break even.
- Profitability Metrics: Metrics like Profit Factor (aim for >1.5) and Expectancy show whether your strategy has a mathematical edge.
- Statistical Significance: Reliable strategies require at least 100 trades to ensure results aren’t due to chance.
Trading Strategy Performance Metrics: Professional Benchmarks and Thresholds
The 6 performance metrics behind WINNING in trading.
sbb-itb-3b27815
Risk-Adjusted Performance Metrics
Risk-adjusted performance metrics are all about understanding whether the returns of a trading strategy are worth the risks taken to achieve them. For example, two strategies might both generate 50% annual returns, but if one has a 10% drawdown and the other has a 45% drawdown, the risk profiles are worlds apart. A strategy with impressive returns can quickly lose its appeal if paired with extreme drawdowns.
These metrics are what separate professional traders from those relying on luck. Rubén Villahermosa sums it up perfectly:
"Risk-adjusted metrics measure how much return you get for each unit of risk taken. They're the difference between a professional trader and a gambler with temporary luck".
They also help traders stick with solid strategies during temporary drawdowns by providing a clear picture of historical risk.
Here’s a reality check: when transitioning from backtesting to live trading, your Sharpe Ratio is likely to drop by 30% to 50%. Why? Real-world trading factors like slippage, execution delays, and market conditions that backtests can’t fully simulate. Understanding these metrics prepares you for this adjustment and helps set realistic expectations. This section lays the groundwork for exploring drawdown, profitability, and statistical metrics in detail.
Sharpe Ratio
The Sharpe Ratio is the go-to metric for evaluating risk-adjusted returns. It shows how much extra return you earn for each unit of volatility (measured by standard deviation). The formula is simple: subtract the risk-free rate (like a Treasury bill) from your strategy’s average return, then divide by the standard deviation of returns.
- A Sharpe Ratio above 1.0 is considered the minimum standard for professionals.
- Ratios above 2.0 indicate institutional-level performance.
- Anything below 1.0 suggests the returns don’t justify the risk.
However, be cautious with extremely high values - a Sharpe Ratio over 3.0 could point to overfitting.
One thing to note: the way you calculate Sharpe Ratios matters. Using daily returns versus monthly returns can lead to differences of 20% for the same strategy. If your returns are autocorrelated (where today’s returns influence tomorrow’s), the difference can jump to 65%. Consistency in calculation is key to making fair comparisons.
The Sharpe Ratio does have a drawback - it penalizes all volatility, even large winning trades. For strategies like trend following, which sometimes catch significant upside moves, this can be misleading. That’s where the Sortino Ratio comes in.
Sortino Ratio
The Sortino Ratio addresses the Sharpe Ratio’s blind spot by focusing only on downside deviation - the volatility of losses. By ignoring the standard deviation of positive returns, it avoids penalizing strategies that occasionally capture large gains. This makes it particularly useful for strategies with asymmetric returns like trend following.
For most well-constructed strategies, the Sortino Ratio should be higher than the Sharpe Ratio. It’s a better fit for evaluating whether the downside risk is acceptable without punishing you for big wins.
Beyond volatility-focused metrics, there are tools specifically designed to assess drawdown impacts.
Calmar Ratio and Ulcer Index
The Calmar Ratio compares your annualized return (CAGR) to your Maximum Drawdown. Instead of looking at average volatility, it highlights the worst-case scenario - the deepest historical loss.
- A Calmar Ratio above 1.0 means your annual return exceeds your worst drawdown, which is a solid benchmark.
- Ratios above 3.0 are considered excellent.
This metric is particularly useful for traders who prioritize preserving capital. It answers a critical question: does the annual return justify the worst drawdown? Remember, recovering from a 50% drawdown requires a 100% gain, while a 75% drawdown needs a 300% gain just to break even.
The Ulcer Index complements the Calmar Ratio by measuring both the depth and duration of drawdowns. It quantifies the psychological stress of a strategy, considering how long you remain in a drawdown. For instance, a 15% drawdown lasting 14 months can feel more painful than a 30% drawdown that recovers in 2 months. An Ulcer Index below 5 indicates low psychological stress, making the strategy easier to stick with long-term.
| Metric | What It Measures | "Good" Value | Best For |
|---|---|---|---|
| Sharpe Ratio | Return per unit of total volatility | 1.0 - 2.0 (Good), >2.0 (Top) | General comparison and industry reporting |
| Sortino Ratio | Return per unit of downside risk only | Higher than Sharpe Ratio | Trend following and asymmetric strategies |
| Calmar Ratio | Annual return vs. worst drawdown | >1.0 (Good), >3.0 (Top) | Conservative traders focused on capital preservation |
| Ulcer Index | Depth and duration of drawdowns | <5 (Low stress) | Measuring psychological "pain" of a strategy |
To get a full picture of a strategy’s performance, don’t rely on just one metric. A strong strategy often combines a Sharpe above 1.0, Sortino above 1.5, and Calmar above 0.8. This balanced approach ensures you’re looking at sustainable, risk-adjusted returns - not just a lucky streak.
Drawdown and Loss Metrics
Risk-adjusted ratios might tell you how efficiently a strategy generates returns, but drawdown metrics reveal the harsh reality of potential losses. As Mark Douglas, author of Trading in the Zone, aptly puts it:
"Drawdown is where good intentions die. It's easy to be disciplined when you're winning; the real test comes when you're losing".
The emotional toll of losses is no small matter. Studies show that the pain of losing is 2 to 2.5 times more intense than the joy of an equivalent gain [13, 17]. For instance, a $10,000 loss feels far worse than the satisfaction of a $10,000 win. Understanding drawdown metrics helps you prepare both mentally and financially for the inevitable challenges every strategy faces.
These metrics also expose vulnerabilities that backtesting alone can't fully reveal.
Maximum Drawdown (MDD)
Maximum Drawdown (MDD) measures the largest percentage drop from a peak to a trough in account equity before a new peak is reached. It’s calculated by subtracting the trough value from the peak value, dividing by the peak value, and multiplying by 100 [13, 15, 17].
The challenge of recovery becomes clear when you consider non-linear growth. A 50% drawdown requires a 100% gain to break even, while a 70% loss demands a staggering 233.3% recovery. At 90%, recovery becomes nearly impossible, requiring a 900% gain [13, 14, 15, 17]. A real-world example? The NASDAQ-100 dropped 83% between 2000 and 2002, requiring a 490% rise over 15 years to recover. This pattern is often summarized by the "Triple Penance Rule", which states that recovery usually takes 2 to 3 times longer than the drawdown period.
In live trading, professionals often apply the 1.5x Rule, assuming live MDD will exceed backtested MDD by about 50% [13, 17]. For example, if your backtest shows a 20% MDD, you should prepare for a 30% drawdown in live trading. Live conditions amplify risks, making this preparation critical.
Another key point: use intraday MDD instead of close-to-close calculations. Intraday tracking captures tick-by-tick fluctuations, which often exceed end-of-day drawdowns. These intraday spikes can trigger margin calls or violate trading limits, even if the account recovers by day’s end.
To safeguard your account, implement a Kill Switch protocol. This involves halting a strategy if drawdown exceeds 1.2x to 1.5x the historical maximum. For instance, if backtesting shows a 25% MDD, set the kill switch between 30%–37.5% to avoid catastrophic losses.
| Drawdown % | Gain Needed to Recover | Difficulty |
|---|---|---|
| 10% | 11.1% | Manageable [13, 17] |
| 25% | 33.3% | Moderate |
| 50% | 100.0% | Severe [13, 17] |
| 75% | 300.0% | Practical Ruin [13, 17] |
| 90% | 900.0% | Game Over |
Recovery Factor
The Recovery Factor (RF) evaluates a strategy’s resilience by comparing total net profit to maximum drawdown.
An RF below 1.0 signals trouble - your strategy struggles to recover losses. Values between 2.0 and 5.0 indicate a solid approach, while anything above 5.0 reflects strong resilience [1, 17]. When comparing strategies with similar profits, the one with a higher Recovery Factor is generally more efficient [1, 7].
Here’s a practical tip: if your Profit Factor is below 1.5 or your Recovery Factor is low, transaction costs and slippage might erode live performance. Accounting for these real-world frictions is essential to ensure your strategy holds up under live conditions.
Another aspect to consider is time underwater - how long your equity stays below its previous peak. A strategy that remains 17% down for 18 months can feel far more grueling than one with a 30% drawdown that recovers in 3 months [1, 17]. Both the depth and duration of drawdowns matter.
| Recovery Factor Value | Interpretation |
|---|---|
| < 1.0 | Dangerous; doesn't compensate for risk |
| 1.0 - 2.0 | Marginal; barely profitable after costs |
| 2.0 - 5.0 | Good; typical of resilient strategies |
| > 5.0 | Excellent; highly resilient [1, 17] |
Growth-to-Drawdown Ratio
The Growth-to-Drawdown Ratio, also called the Calmar Ratio, compares annualized returns (CAGR) to Maximum Drawdown. This metric helps traders assess performance over different timeframes.
A ratio above 1.0 indicates that annual returns exceed the worst historical drawdown - a solid benchmark. Ratios above 2.0 are highly desirable, especially for risk-averse traders focused on preserving capital [1, 17].
Position sizing plays a critical role in improving this ratio. Since position sizes directly influence MDD, managing them carefully can help control drawdown depth and enhance overall performance [13, 14].
These metrics, when combined, provide a clearer picture of potential losses and set the stage for evaluating profitability and consistency in the next section.
Profitability and Consistency Metrics
While drawdown metrics highlight potential losses, profitability metrics are what truly reveal the strength of your trading strategy. These metrics help determine if your approach has a mathematical advantage or if you're just treading water. Without positive profitability metrics, even the best mindset, discipline, or position sizing won't turn a losing strategy into a winning one.
Unfortunately, many retail traders focus on the wrong metrics, which often leads to losses. To succeed, you need to understand three key profitability metrics.
Profit Factor
Profit Factor (PF) measures how efficiently your strategy generates profit by dividing total gross profit by total gross loss. For example, a PF of 2.0 means you’re earning $2 for every $1 lost. A PF above 1.0 signals profitability, while anything below 1.0 indicates that losses are inevitable. New traders often mistakenly prioritize win rates over Profit Factor, which can be misleading.
To account for slippage and trading costs, aim for a PF of at least 1.5. A range between 2.0 and 3.0 reflects a strong performance, but if the PF exceeds 4.0, it might indicate over-optimization, making the strategy less reliable in live markets.
For accurate results, test your strategy over at least 100 trades, though some experts recommend 400 to ensure reliability. It’s also useful to compare Profit Factor across different trading sessions, like London, New York, and Asian markets. If a session consistently shows a PF below 1.2, it might be best to avoid trading during that time.
| Profit Factor | Rating | Description |
|---|---|---|
| < 1.0 | Losing | Strategy loses money overall |
| 1.0 – 1.5 | Weak/Fragile | Barely profitable; vulnerable to costs and slippage |
| 1.5 – 2.0 | Solid | Good edge with proper risk management |
| 2.0 – 3.0 | Strong/Robust | Excellent edge; professional-grade |
| > 4.0 | Suspicious | Likely over-optimized; risky in live markets |
Next, we’ll dive into two related metrics: win rate and win/loss ratio.
Win Rate and Win/Loss Ratio
The win rate shows the percentage of trades that are profitable, while the win/loss ratio compares the size of your average win to your average loss. Neither metric tells the full story on its own.
Interestingly, many retail forex traders lose money even with win rates of 50–55%. A study of 10,000 retail accounts found that traders with win rates above 70% often had worse returns than those with win rates between 45–55%, usually due to poor risk management.
Small but frequent wins can tempt traders to close profitable trades too early while letting losses grow. As Alexander Elder wisely notes:
"It's essential to wait for trades with good risk/reward ratios. Patience is a virtue for traders".
Different strategies call for different win rate and win/loss ratio combinations. For instance, trend-following systems often have low win rates (30–40%) but high win/loss ratios (above 2:1), while scalping strategies aim for high win rates (60–75%) with lower win/loss ratios. You can calculate your breakeven win rate using this formula:
breakeven win rate = 1 / (1 + Win-Loss Ratio)
For example, with a 2:1 win/loss ratio, you only need to win 33.3% of your trades to break even. With a 3:1 ratio, just 25% is enough. Professional traders often prioritize improving the win/loss ratio over increasing the win rate because a strong ratio compensates for fewer wins.
| Win/Loss Ratio | Minimum Win Rate to Break Even | Professional Usage Context |
|---|---|---|
| 1:1 | 50.0% | Not recommended |
| 1.5:1 | 40.0% | Minimum acceptable |
| 2:1 | 33.3% | Standard for swing trading |
| 3:1 | 25.0% | Ideal for trend-following |
| 5:1 | 16.7% | Elite-level systems |
Now, let’s look at how expectancy and R-multiples help measure a strategy's overall profitability.
Expectancy and R-Multiple
Expectancy calculates the average profit or loss you can expect per trade over the long run, making it a cornerstone of any profitable trading system. The formula is:
Expectancy = (Win Rate × Average Win) − (Loss Rate × Average Loss)
A positive expectancy (greater than 0) means your strategy is mathematically sound and capable of generating profits over time. A negative expectancy, on the other hand, guarantees long-term losses, no matter how disciplined you are. As the Gotrade Team puts it:
"Confidence comes from math, not hope".
For instance, a strategy with a 40% win rate and a 2.5:1 reward-to-risk ratio might earn +$40 per trade, while another with a 65% win rate but only a 0.8:1 ratio might earn just +$17 per trade. This highlights how a better risk/reward balance can outperform a higher win rate.
Expressing expectancy in R-multiples (where R is your initial risk) allows for easy comparison across accounts of different sizes. The formula is:
R-multiple = (Win Rate × Average R-Win) − (Loss Rate × 1)
Consistently profitable traders achieve expectancies of $0.20–$0.80 per dollar risked. For initial estimates, test at least 30–50 trades, though 100–200 trades provide greater confidence. Using Cochran’s formula, you’d need 101 trades for 70% confidence in expectancy and 666 trades for 99% confidence.
| Expectancy Value | Classification | Interpretation |
|---|---|---|
| < 0.0R | Negative | Losing system; revise or abandon |
| 0.0R - 0.2R | Marginal | Barely sustainable; vulnerable to costs |
| 0.3R - 0.5R | Solid | Meets professional standards |
| > 0.5R | Excellent | Highly reliable and profitable |
To improve expectancy, focus on increasing your average win by letting profitable trades run, or reduce your average loss with tighter stop-losses. Always aim for setups with at least a 2:1 reward-to-risk ratio to maintain a strong mathematical edge.
If you’re using tools like Traidies to automate strategies, these metrics become even more vital. Traidies’ backtesting allows you to calculate Profit Factor, expectancy, and win/loss ratios across thousands of trades, giving you the data you need to identify strategies with real potential - before risking actual money.
Volume and Statistical Significance Metrics
When evaluating profitability and loss metrics, it's essential to ensure that your results are statistically reliable. One way to verify this is by examining trade volume. Trade volume helps determine whether your backtest outcomes reflect a genuine trading edge or are simply the result of chance. Without sufficient data, you're essentially analyzing noise instead of actionable insights.
Statistical tests generally require a minimum of 30 trades, but seasoned analysts often look for 100 to 200 trades to feel confident in their conclusions. For instance, a 70% win rate based on just 10–20 trades can fluctuate wildly, making it unreliable. Similarly, achieving a 65% win rate over 20 trades often results in a p-value above 0.2 - indicating a 20% likelihood that the result is due to randomness. However, when the same win rate is observed over 200 trades, the p-value drops below 0.01, signaling much stronger statistical reliability.
Another crucial factor is the independence of trades. If all 300 trades in your backtest occurred during a single bull market, they would be highly correlated, making the results less reliable. In contrast, 80 independent trades spread across different market conditions provide a much stronger foundation for analysis. As Trading Dude aptly puts it:
"Without enough data, your backtest is a marketing deck - not evidence".
For strategies with a 50% win rate, achieving 95% confidence with a 5% margin of error requires at least 385 trades. If your strategy doesn't naturally generate this many trades, consider extending the backtest period to 10–20 years or testing it across multiple unrelated assets.
Total Deals and Trade Count
The number of trades in your backtest directly affects the reliability of your findings. Backtests with fewer than 50 trades generally produce unreliable results. A trade count between 50 and 100 may offer preliminary insights but lacks the confidence needed to justify risking real money. Once you hit 100–200 trades, results start to hint at a potential edge, while 200–500 trades provide the kind of reliability that institutions demand for decision-making across varying market conditions.
Different trading strategies require different sample sizes. For example:
- Day trading strategies can quickly accumulate 200+ trades due to their high frequency.
- Swing trading usually needs 100+ trades, which often means analyzing 6–12 months of data.
- Position trading strategies should aim for at least 50 trades, which may require testing across multiple assets to meet this threshold.
Kevin Davey, a professional algorithmic trader, emphasizes that only 1 in 20 strategies typically survives the rigorous validation process required for live trading. If your backtest includes fewer than 30 trades, it’s time to either scrap the strategy or significantly refine it. For low-frequency strategies, tools like bootstrapping or Monte Carlo simulations can help estimate confidence intervals and account for potential variances.
Equity Curve Analysis
An equity curve provides a visual representation of your account's performance over time and can reveal issues that raw numbers might miss. A steady, upward-sloping curve - around a 45-degree angle - suggests disciplined, rule-based trading with a consistent edge. Conversely, sharp spikes followed by deep drops often indicate emotional trading or poor risk management.
Watch out for step-like patterns in the curve, where profits hinge on a few lucky trades. This indicates a lack of consistency, which makes the strategy risky. Similarly, an equity curve that looks "too perfect" - with minimal drawdowns - might be over-optimized and unlikely to perform well in live trading. Real-world conditions naturally include some volatility, so an overly smooth curve can be a red flag. For example, a backtested curve showing a maximum drawdown below 3% may not hold up under actual market conditions.
Between 2020 and 2025, Quant Signals backtested the EMA Crossover (9/21) strategy on BTCUSD using daily timeframes. Over 88 trades, this strategy achieved a Profit Factor of 1.59, a Sharpe Ratio of 3.49, and a maximum drawdown of 4.6%, resulting in a positive expectancy of +0.330R per trade. In contrast, their backtest of the London Breakout strategy on GBPUSD during the same time period resulted in a disastrous 133.5% maximum drawdown and a Profit Factor of 0.25 across 695 trades - a performance that could easily wipe out an account.
A practical tip is to smooth your equity curve using a moving average. For intraday trading, a 25-period moving average works well, while swing traders might prefer a 50-period moving average. If the equity curve dips below its moving average, reducing position sizes by 50% can help protect your capital during downturns.
Holding Time and Trade Streaks
Average holding time - how long trades remain open - can provide valuable insights. Breaking this metric into "Winning Trades Avg Holding Time" and "Losing Trades Avg Holding Time" can highlight potential issues. For example, if losing trades stay open significantly longer than winning ones, it may indicate a reluctance to cut losses quickly. Additionally, for instruments like perpetual futures, extended holding times can lead to funding fees that erode profits.
Tracking winning and losing streaks is equally important. These streaks help you prepare psychologically and set "stop criteria" for your strategy. For instance, if your backtest shows a maximum losing streak of 5 trades, but you experience 8 consecutive losses in live trading, it could mean the strategy is over-optimized or that market conditions have changed. A good rule of thumb is to pause the strategy if live losing streaks exceed 1.5 times the maximum recorded during backtesting. This precaution can help prevent significant losses.
Another critical metric is "time underwater" - the period from an equity peak to when a new high is reached. This can be more mentally challenging than the depth of a drawdown. For example, a 30% drawdown that recovers in two months is often easier to handle than a 15% drawdown that lasts 14 months. Understanding your strategy's typical time underwater can help you prepare for these inevitable rough patches.
If you're using Traidies for automated backtesting, these metrics become essential tools. Traidies allows you to analyze thousands of trades, helping you separate genuine performance from luck. Before risking real money, make sure your backtest includes at least 100 trades and that the equity curve demonstrates consistent, steady gains rather than relying on a few outlier trades.
Applying Metrics: From Backtesting to Live Trading
Once you've fine-tuned your parameters and analyzed countless trades, the next hurdle is translating backtest results into live market performance. This step is where many strategies stumble - not because the metrics are flawed, but because traders often misread how those numbers behave under real-world conditions.
Benchmarking Against Industry Standards
Before putting real money on the line, compare your strategy's metrics to established benchmarks. For instance, the S&P 500 has historically achieved a Sharpe Ratio of about 0.5, while multi-strategy hedge funds aim for around 2.2 as of 2024. If your backtest shows a Sharpe Ratio above 3.0, it might be a sign of overfitting rather than genuine predictive capability. Similarly, Renaissance Technologies averages roughly 66% annual returns - anything significantly higher should raise questions.
Here’s a quick guide to assess whether your strategy is ready for live trading:
| Metric | Minimum for Live Trading | Professional Grade | Institutional/Elite |
|---|---|---|---|
| Profit Factor | > 1.5 | 1.75 – 2.0 | 2.0 – 3.0 |
| Sharpe Ratio | > 1.0 | 1.0 – 1.5 | 2.0 – 3.0+ |
| Max Drawdown | < 25% | 10% – 20% | < 10% |
| Total Trades | > 50 | > 100 | > 200 |
| Expectancy | > 2× transaction costs | > 3× transaction costs | > 5× transaction costs |
For expectancy, make sure it surpasses transaction costs by at least 2–3×. For example, if slippage and commissions add up to $15, your expectancy should be at least $30–$45.
With these benchmarks in mind, the next challenge is ensuring your strategy avoids overfitting when transitioning to real-world trading.
Using Metrics to Identify Overfitting Risks
Once your strategy meets industry standards, the next step is to assess its sensitivity to historical data and confirm it has a genuine edge. Overfitting happens when a strategy captures random noise instead of actual market patterns.
"A quant's real skill isn't building strategies - it's doubting them".
One way to check for overfitting is by splitting your data: 70% as In-Sample for optimization and 30% as Out-of-Sample for validation. A large performance gap between these datasets is often a red flag. For example, Strateda evaluated a long-only EMA crossover strategy on BTCUSD (M30 timeframe) from January 2024 to March 2026. The backtest showed an 11.62% return with a 0.97 Sharpe Ratio. After applying a 5-window Walk-Forward Optimization, the p-value was 0.008 - indicating less than a 1% chance that the out-of-sample results were random.
To confirm robustness, aim for:
- Walk-Forward Efficiency above 70%
- Parameter stability in 70–80% of variations
Run sensitivity tests by tweaking key inputs slightly. A robust strategy will show a stable "performance plateau", while an overfitted one will display sharp "cliffs" with small changes.
Monte Carlo simulations are another tool to test robustness. By randomly shuffling trade sequences thousands of times, you can see if success depends on the order of trades or a genuine edge. Use the 95th percentile maximum drawdown from these simulations to guide position sizing, rather than relying solely on backtest results.
Watch out for these overfitting warning signs:
| Warning Sign | Why It Matters |
|---|---|
| Win Rate > 75–80% | Indicates reliance on low risk/reward ratios, which can be unsustainable |
| Profit Factor > 3.0 | Often signals curve-fitting rather than a real edge |
| Sharpe Ratio > 3.0 | Rarely achievable in live trading |
| Too Many Rules | Excessive conditions increase the risk of fitting noise |
| Perfect Equity Curve | A smooth curve is often a sign of overfitting |
Step-by-Step Workflow for Strategy Refinement
To ensure your strategy is ready for live trading, follow these steps:
1. Reserve Out-of-Sample Data
Set aside 20–30% of historical data as Out-of-Sample, and avoid optimizing your strategy on this data.
"If you torture the data long enough, it will confess to anything".
Avoid the temptation to tweak your strategy after viewing Out-of-Sample results. Doing so turns that data into In-Sample and invalidates its use for validation.
2. Ensure Economic Rationale
Every parameter should have a logical reason behind it. For example, if your strategy buys only on Wednesdays or uses a 17-period moving average just because it "tested best", it's likely capturing random patterns rather than a sustainable market edge. Ask yourself: Why should this work? If the answer isn’t clear, it’s unlikely to succeed live.
3. Account for Degradation
Expect live trading results to underperform backtests due to slippage, commissions, and execution delays. Assume live drawdowns will be 1.5× to 2× higher than backtested results.
"Metrics in live trading are always worse than backtests. Build in safety margins".
4. Transition Gradually
Start with paper trading for two weeks to get comfortable with execution. Then, trade at the smallest position size - such as single shares or micro lots - for 20–30 trades. Only scale up to 25% of your target position size after verifying that live metrics align with backtests, and gradually increase from there.
5. Define Shutdown Criteria
Set clear rules for when to pause or stop trading. For example, if your backtest shows a maximum losing streak of 5 trades, stop trading if you hit 8 consecutive losses - about 1.5× the backtested maximum. Similarly, if Monte Carlo simulations predict a 95th percentile drawdown that exceeds your risk threshold, halt trading immediately. These safeguards help prevent catastrophic losses when market conditions change.
If you're using platforms like Traidies for automated backtesting, apply these steps rigorously. Traidies' AI tools can test thousands of parameter combinations, so it's crucial to guard against overfitting. Use features like Walk-Forward Optimization and Monte Carlo simulations to validate your strategy before going live.
Conclusion: Key Takeaways for Using Trading Metrics
When it comes to trading metrics, a balanced approach is key. No single metric can give you the full picture of a trading strategy's potential. For instance, focusing solely on net profit can be misleading if you ignore the risks involved. Consider this: a strategy that earns $50,000 with a 5% maximum drawdown is much safer than one that earns the same amount but with a 45% drawdown. The latter carries a much higher risk of both emotional strain and potential account failure.
To get a clearer view of your strategy, combine metrics from three main categories: profitability (like Profit Factor and Expectancy), risk management (such as Maximum Drawdown and Recovery Factor), and risk-adjusted performance (including Sharpe Ratio and Sortino Ratio). This mix not only highlights your strategy's strengths but also pinpoints areas that need improvement as you prepare for live trading. For those just starting out, even a 1:3 risk/reward ratio can lead to profitability with just a 25% win rate.
Another critical factor is statistical significance. A strategy with impressive results over only 20 trades doesn’t inspire much confidence. Reliable strategies typically require at least 100 trades over a six-month period to ensure dependable performance. It's also worth noting that around 90% of strategies that seem profitable in backtests fail when applied to real trading due to overfitting.
Before going live, ensure your strategy meets key benchmarks: a Profit Factor above 1.5, a Sharpe Ratio greater than 1.0, and a Maximum Drawdown below 25%. Just as important, only trade strategies you can handle emotionally - especially when drawdowns hit 1.5 times the backtested maximum. Emotional stress tends to spike when drawdowns exceed 20%.
"Checking your profit and loss at month-end is like driving a car while only watching the speedometer - ignoring fuel levels, engine temperature, and every warning light on the dashboard." - TraderLens Team
FAQs
Which metrics matter most for my strategy type?
When it comes to evaluating trading strategies, the most important metrics will vary depending on your approach. However, some metrics are universally important. For short-term or algorithmic trading, key metrics include the Sharpe Ratio, profit factor, win rate, and maximum drawdown. These help you measure risk-adjusted returns and overall profitability.
For strategies that prioritize consistency, metrics like maximum drawdown and expectancy take center stage. Combining several metrics provides a well-rounded view of your strategy’s performance, ensuring you understand its strengths and weaknesses.
How many trades do I need to trust my backtest?
To get reliable results, a backtest needs a sample size of at least 200 to 500 trades. Why? Because this range helps account for different market environments - like bull, bear, and sideways trends. By testing across these varied conditions, you can achieve results that are far more consistent and trustworthy.
How do I set a safe kill switch drawdown limit?
To safeguard your trading account, establish a maximum drawdown percentage you're comfortable with - something like 10-15% of your account equity is often a reasonable range. Implement an automated system to monitor your account equity in real-time. When the drawdown hits your preset limit, the system will trigger a stop, halting further trading. This approach helps protect your capital, minimizes losses, and forces a pause during challenging drawdown periods.