How AI Improves Anomaly Detection in Trading

How AI Improves Anomaly Detection in Trading
Detecting anomalies in trading is critical to managing risks and minimizing losses. AI has transformed this process by analyzing vast amounts of financial data in real-time, identifying unusual patterns that traditional methods often miss. Here’s what you need to know:
- What are anomalies? Sudden price spikes, flash crashes, or irregular trading volumes that deviate from expected market behavior.
- Why AI? Unlike static methods, AI models like Transformers and LSTMs adapt to market changes, analyze multiple data streams, and achieve higher detection accuracy.
- Key techniques: Supervised models for known patterns, unsupervised models for unexpected irregularities, and forecasting methods that flag deviations from predictions.
- Practical application: AI assigns anomaly scores, which can trigger actions like halting trades or adjusting positions, ensuring faster and more precise decisions.
- Tools like Traidies: Simplify strategy creation, code generation, and backtesting, enabling traders to implement AI-driven workflows efficiently.
AI doesn’t just detect anomalies - it integrates them into actionable strategies, improving the way traders respond to market events.
How AI Can Uncover Hidden Stock Market Secrets!
sbb-itb-3b27815
Key AI Techniques for Detecting Trading Anomalies
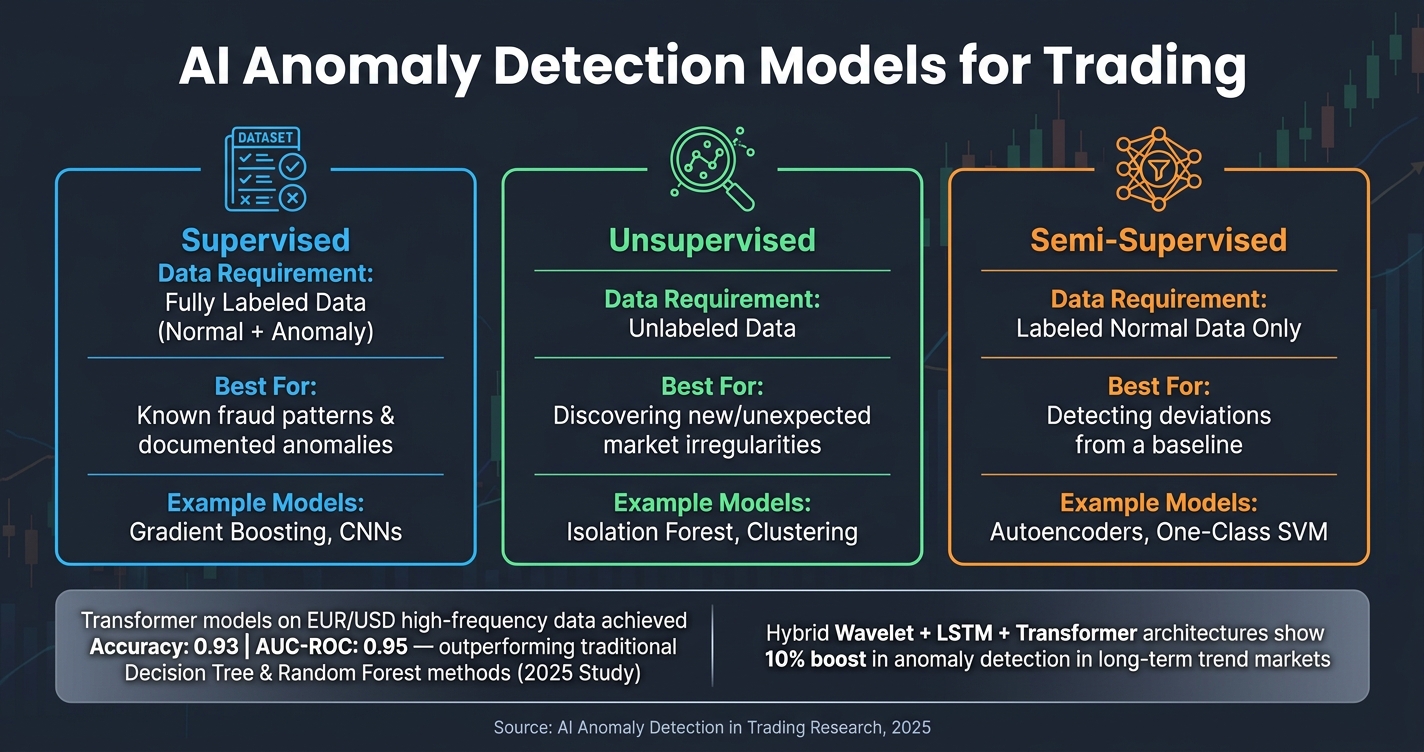
AI Anomaly Detection Models for Trading: Supervised vs Unsupervised vs Semi-Supervised
AI models don't all approach anomaly detection in the same way. The best model depends on the data you have, what you're trying to find, and how clearly "normal" market behavior can be defined.
Supervised, Unsupervised, and Semi-Supervised Models
These approaches refine anomaly detection by focusing on specific patterns. Each learning method plays a unique role in trading scenarios:
- Supervised models like gradient boosting rely on labeled datasets that include examples of both normal and anomalous events. They’re ideal for spotting known patterns, such as documented fraud schemes.
- Unsupervised models, such as Isolation Forests, don’t need labeled data. They assume anomalies are rare and structurally distinct from the rest of the data, making them perfect for identifying unexpected market irregularities.
- Semi-supervised models, like Autoencoders, combine the two. They train on clean, normal data and flag anything that deviates significantly from that baseline.
Autoencoders, for example, compress data and then reconstruct it. If the reconstruction error is high, it signals an anomaly.
Here’s a quick comparison of these learning schemes:
| Learning Scheme | Data Requirement | Best For | Example Models |
|---|---|---|---|
| Supervised | Fully labeled (Normal + Anomaly) | Known fraud patterns | Gradient Boosting, CNNs |
| Unsupervised | Unlabeled data | Discovering new irregularities | Isolation Forest, Clustering |
| Semi-supervised | Labeled "normal" data only | Detecting deviations from a baseline | Autoencoders, One-Class SVM |
While these models are great for static classification, sequence models are better suited for tracking market changes over time.
Sequence Models for Time-Series Data
Markets are dynamic, and tracking data over time helps uncover subtle trends. For instance, a single price spike is easy to spot, but identifying a slow liquidity drain leading to a flash crash is far more complex. That’s where sequence models come in.
LSTMs (Long Short-Term Memory networks) excel in identifying evolving patterns. Their gating mechanisms help retain or discard information over multiple time steps, capturing long-term trends like market cycles and price movements. Meanwhile, Transformers use self-attention mechanisms to model both short-term fluctuations and broader dependencies across an entire sequence.
Tian Su, a lead author at Meta Platforms Inc., highlights the strengths of Transformers:
"LSTM models still face limitations in capturing long-term dependencies and detecting sudden anomalies. In contrast, the self-attention mechanism in Transformer models enables the modeling of global information, making them particularly effective in capturing short-term fluctuations."
Research supports this. A 2025 study applied a sliding window Transformer to high-frequency EUR/USD trading data and achieved an accuracy of 0.93 and an AUC-ROC of 0.95, outperforming traditional decision tree and random forest methods. Additionally, hybrid architectures combining Wavelet Transform, LSTM, and Transformer components have shown a 10% boost in anomaly detection performance in long-term trend markets.
While sequence models focus on temporal patterns, forecast-based techniques use prediction errors to spotlight unexpected shifts.
Forecast-Based Anomaly Detection
Forecasting-based methods rely on discrepancies between predicted and actual market behavior to flag anomalies. When a model predicts one outcome but the market behaves differently, it’s a signal that something unusual might be happening. The difference between the prediction and reality becomes the anomaly score.
This approach is especially useful for identifying breaks in patterns or significant regime changes. Deep learning models like LSTMs and Transformers often serve as the forecasting engine, with anomalies detected through prediction errors. Autoencoders can also be used for forecasting by reconstructing input data; large reconstruction errors suggest deviations from the norm.
AI researcher Leo Mercanti explains:
"Anomalies are detected when the reconstruction error exceeds a certain threshold, indicating that the input data deviates from the norm."
To make this method more effective, incorporating multi-dimensional features - such as order book depth, trading volume, and spread alongside price - can greatly improve forecast precision. Splitting the dataset into training, validation, and testing windows ensures the model adapts to changing market conditions without overfitting to historical data.
How to Build an AI-Driven Anomaly Detection Workflow
Creating an AI-driven anomaly detection workflow involves selecting the right AI model and integrating it into a trading strategy through a structured process. This process connects the dots between choosing the model and executing trades in real time. Each step plays a role in improving trading decisions, with a focus on precision and efficiency.
Defining Goals and Metrics
The first step is to define the types of anomalies you want to detect. Not all anomalies are the same - each requires a tailored response. A simple three-tier classification system works well:
- Critical: Halt the trade immediately.
- Warning: Adjust by reducing position size.
- Minor: Log the event and monitor it.
This classification ensures that minor fluctuations don’t cause unnecessary disruptions.
Next, set clear and measurable performance targets for your model. For instance, aim for an F1-Score above 0.90 and an AUC-ROC exceeding 0.95. Research on high-frequency EUR/USD data suggests these benchmarks are achievable with well-optimized Transformer models. Additionally, establish an acceptable false positive rate early on to avoid drowning in alerts caused by routine market noise.
"Time-series anomaly detection is fundamentally harder because the definition of 'unusual' depends on temporal context - patterns that are normal at one time are anomalous at another." - AI Code Invest
Preparing Data for Anomaly Detection
Clean, well-structured data is the foundation of any successful anomaly detection system. Start by transforming raw price data into percentage returns. This makes the dataset more stationary and easier for models to handle. When detecting volatility or outliers, use Median Absolute Deviation (MAD) instead of standard deviation. MAD is less affected by the fat tails common in financial markets, which can distort standard z-scores.
Feature engineering is where the real insights emerge. Build your dataset by layering inputs across three key dimensions:
- OHLCV candles: Capture volume spikes and shifts in volatility.
- Order book metrics: Include factors like bid-ask spread and depth imbalance.
- Volume concentration metrics: Track the percentage of total volume coming from top trades.
Before feeding this data into models like Isolation Forest, apply a StandardScaler. This ensures features with different units are treated equally. Also, filter out problematic data - such as zero-price entries or extreme spikes from unreliable API feeds - early in the process. Faulty data can lead to false anomalies, skewing your results.
With clean and well-prepared data, you’re ready to connect anomaly scores to actionable trading strategies.
Adding Anomaly Scores to Trading Logic
Once your model generates an anomaly score, the next challenge is turning that score into real trading decisions. The most effective way to do this is by tying score thresholds directly to specific actions, rather than relying on manual interpretation.
Here’s an example of a practical setup:
- Critical scores (e.g., z-scores above 10): Stop all new trades immediately.
- Warning scores: Trigger position size reductions or switch to a more conservative strategy.
- Minor scores: Log these for use in future model retraining.
This tiered approach ensures the system remains responsive without overreacting.
"The faster we detect anomalies in data, the faster action can be taken to prevent poor performance and damage." - Madhura Raut, Data Scientist
For real-time trading, a streaming architecture is crucial. The system should be able to ingest trade data, run the detection model, and send scores to your strategy engine with minimal delay. High-frequency traders require sub-second detection, while swing traders can tolerate slightly higher latency. Regardless of the strategy, the anomaly score must play a central role in your trading logic - not just an afterthought.
Using Traidies to Implement AI-Powered Anomaly Detection

Once you’ve outlined your detection workflow, the next step is to turn your strategy into functional code and test it using real market data. With the framework built in earlier sections, Traidies simplifies this process by converting your strategy logic into executable code and enabling backtesting for performance evaluation.
Generating MQL5 Code for Anomaly Detection
Traidies makes it easy to create MQL5 code by translating natural language descriptions of your strategy into a working Expert Advisor (EA) or indicator. For example, you might describe your logic as: “If the current bar’s return exceeds 2 standard deviations from the rolling mean of the last 20 bars, reduce position size by 50%.” Traidies’ AI Strategy Parser converts this into functional code.
A key feature to include is a Sigma Score (z-score) to identify moves beyond ±2 standard deviations, as this range covers roughly 95% of observations. For more complex strategies, you can integrate OpenCL kernels, allowing the code to handle heavy calculations efficiently within the MetaTrader 5 environment.
Before using the AI generator, it’s helpful to draft your strategy in pseudocode. Define variables like alarm thresholds, rolling window sizes, and alert types upfront to ensure the generated code is clean and reliable. While Traidies handles the heavy lifting, reviewing the output with basic MQL5 knowledge can help you spot potential edge cases or errors.
Once your EA is ready, the next step is to backtest its performance using historical market data.
Running Backtests with Historical Data
Traidies automates backtesting for your EA using historical OHLCV data. To ensure your strategy isn’t overfitting, split the data into a training set and an out-of-sample test set. This split helps verify whether the strategy can generalize beyond the data it was trained on.
When setting up your backtest, use realistic assumptions like a spread markup of 0.2 on XAUUSD. This prevents overly optimistic results that wouldn’t hold up in live trading conditions. Evaluate the EA's performance using metrics such as profitability, maximum drawdown, win rate, and the R² value of the equity curve. Below is a summary of the key backtesting phases:
| Backtesting Phase | Key Action | Method |
|---|---|---|
| Preprocessing | Feature creation & clustering | Standard deviation, K-Means |
| Training | Model fitting with validation | 70/30 or 80/20 data split |
| Out-of-Sample Testing | Forward test on unseen data | MT5 Strategy Tester, R² metric |
| Refinement | Adjust hyperparameters | Iteration reduction, early stopping |
Once the backtesting results confirm the EA’s effectiveness, you can move on to refining your strategy.
Refining Strategies with AI-Assisted Tools
After analyzing backtest results, you can fine-tune your strategy by adjusting anomaly detection conditions directly in natural language. For example, if your forward test reveals too many false positives, you could instruct Traidies to “raise the sigma threshold from 2.0 to 2.5 and add a smoothing period of 3 bars before triggering a warning.” The tool will regenerate the MQL5 code with these updates applied automatically.
This iterative process - describe, generate, test, refine - allows traders to experiment with different sensitivity levels, thresholds, and risk parameters. For instance, you might test whether tighter volatility thresholds (e.g., 1.0 to 3.0 standard deviations) are more effective in ranging markets compared to trending ones. All of this can be done without manually editing the underlying code, making it faster and more efficient to optimize your strategies.
Best Practices for AI Anomaly Detection in Trading
Once you've set up your AI workflow, it's essential to follow practices that maintain the model's effectiveness and reduce unnecessary noise.
Tracking Model Performance Over Time
Markets are constantly evolving, and this can make a previously reliable model less effective - a phenomenon known as concept drift. This drift often leads to a significant drop in live performance compared to backtest results. For instance, quantitative experts have noted that a model's Sharpe ratio can decline by 50% or more when transitioning from backtesting to live trading due to market changes and execution costs.
To stay ahead of concept drift, monitor feature stability using rolling windows. If the key features influencing your anomaly scores are shifting randomly week to week, it’s a sign the model might be picking up on noise instead of meaningful market patterns. Combine this with walk-forward optimization, where you train the model on a fixed data window, test it on the next segment, and then move the window forward. This technique mimics how the model will react to emerging market conditions.
Before fully deploying your model, test it in shadow mode. In this phase, the model produces signals without executing trades, allowing you to compare its outputs against real market behavior. This approach helps identify and correct flawed assumptions early.
"A model that makes 20% consistently across all market regimes is infinitely more valuable than one that makes 200% in a backtest but fails in the first week of live trading." - QuantStrategy.io Team
Once you’ve established a system for tracking performance, the next step is improving the quality of alerts.
Reducing False Positives and Notification Overload
Too many false alerts can drown out meaningful signals. To address this, use meta-labeling to identify and filter out non-actionable alerts. Additionally, implement tiered notification levels to ensure critical signals get the attention they deserve. For example, applying a Random Forest classifier to filter a EUR/USD breakout strategy improved the win rate from 42% to 58% while cutting the maximum drawdown by half.
Another useful tactic is adding cooldown windows, which enforce a minimum time gap between alerts for the same asset. This prevents a single volatile event from generating a flood of redundant notifications.
"The goal of an AI filter is to improve quality over quantity. By reducing the number of 'noisy' trades, you improve your win rate and lower transaction costs." - QuantStrategy.io Team
Governance and Compliance Considerations
Operational efficiency isn’t the only priority - regulatory compliance is just as important. Traders operating in regulated environments need to document all market data inputs to comply with frameworks like CRR3 and FRTB. These frameworks require that data used for risk calculations, such as VaR and Expected Shortfall, be accurate, complete, and suitable for regulatory purposes. Poor-quality data can inflate capital costs by overestimating risk.
To meet these standards, adopt a three-layer storage architecture for raw data, derived features, and event logs. This ensures data integrity and allows for full traceability of every alert back to its original inputs. Additionally, focus on model explainability by attaching concise, human-readable reasons to each signal. For instance, tagging an alert with "volume spike + thin liquidity + high reversal risk" makes it easier for compliance teams to review flagged events.
| Governance Component | Requirement | Implementation Strategy |
|---|---|---|
| Data Integrity | Accuracy & completeness | Automated outlier filtering and data validation |
| Auditability | Full traceability | Separate storage for raw data, derived features, and event logs |
| Explainability | Logic transparency | Weighted scoring with short text explanations per alert |
| Risk Control | Capital protection | Position sizing tied to alert confidence scores |
| Model Health | Drift detection | Monitoring PSI and rolling Sharpe ratios |
"Both the Standardised Approach (SA) and Internal Models Approach (IMA) mandate that market data inputs used for pricing, VaR, and Expected Shortfall calculations be accurate, complete, and suitable for regulatory use." - Merijn Van Miltenburg, Financial Risk Manager
Conclusion: Using AI for Better Anomaly Detection in Trading
AI has reshaped how traders identify and react to unusual market activity. Traditional statistical methods often struggle with high-dimensional data and complex, non-linear relationships. In contrast, AI models - especially Transformer architectures - have demonstrated impressive performance, achieving accuracy rates of 0.93 and AUC-ROC scores of 0.95 when applied to real high-frequency trading data. These results highlight a major improvement in detection capabilities.
But AI’s impact goes beyond just better accuracy. The real value lies in how insights are applied. It’s not just about detecting anomalies faster but about making smarter decisions. As noted by Business Insider Africa:
"The main advantage is not prediction. The advantage is classification and filtering. AI can label the current market state, detect when behavior is abnormal compared to recent history, and reduce the number of low quality signals a trader acts on." - Business Insider Africa
By combining this advanced filtering capability with strong governance practices - such as data traceability, explainable alerts, and drift monitoring - you create a system that stays reliable and compliant over time.
For those looking to implement these tools, Traidies offers an accessible solution. Their platform allows you to describe your anomaly detection logic in simple terms, instantly generate MQL5 code, and validate it against historical data through automated backtesting - no manual coding required.
In the fast-paced world of trading, the ability to respond swiftly and accurately to anomalies is critical. AI equips traders with the tools to meet this challenge head-on.
FAQs
How do I pick the right anomaly detection model for my strategy?
Choosing the best anomaly detection model hinges on the nature of your data and the dynamics of your market. For datasets with high-dimensional and non-linear characteristics, neural networks like autoencoders are a strong choice. On the other hand, if you're dealing with time-series data, models such as Isolation Forest often perform effectively. In markets that are constantly changing, it's crucial to select models that can adjust to new data over time. Tools powered by AI, like those offered by Traidies, can make this process easier by automating tasks like strategy descriptions, code generation, and backtesting.
What anomaly score threshold should I use to trigger trades or halts?
The best anomaly score threshold depends on your specific model and the conditions of your market. Finding the right balance is key - your threshold needs to be sensitive enough to detect unusual behaviors but not so strict that it results in excessive false positives or overlooks important anomalies. Achieving this balance usually requires thorough backtesting and validation to ensure the threshold supports your strategy's objectives and aligns with its performance metrics.
How can I reduce false positives as market conditions change?
To keep false positives in check as market conditions change, it's crucial to use AI models that can adjust to shifting data patterns. For example, neural networks with dynamic processing can adapt while retaining vital market characteristics and reducing information loss. On top of that, AI-driven tools like sentiment analysis or filters for volatility regimes can help separate real signals from background noise. This ensures that anomaly detection stays sharp and reliable, even in fluctuating market environments.