How AI Automates Volume Analysis in MQL5

How AI Automates Volume Analysis in MQL5
AI simplifies volume analysis in trading by automating data processing, pattern recognition, and predictive modeling. By leveraging tools like Isolation Forest and LSTM neural networks, traders can identify unusual market activity, predict volume trends, and refine strategies. MQL5, a trading platform, integrates seamlessly with AI workflows, allowing users to access volume data, train models, and execute trades efficiently. Key benefits include:
- Volume Insights: AI detects spikes and patterns in both tick and real volume data.
- Anomaly Detection: Isolation Forest flags irregular trading activity.
- Market Phases: K-Means clustering categorizes market conditions.
- Predictive Modeling: LSTM networks forecast future volume and price movements.
- MQL5 Integration: Enables real-time data handling, backtesting, and model execution.
With proper data preparation and feature engineering, AI-driven strategies can improve decision-making and trading outcomes. This approach combines advanced analytics with MQL5's robust execution capabilities, enabling traders to respond to market dynamics effectively.
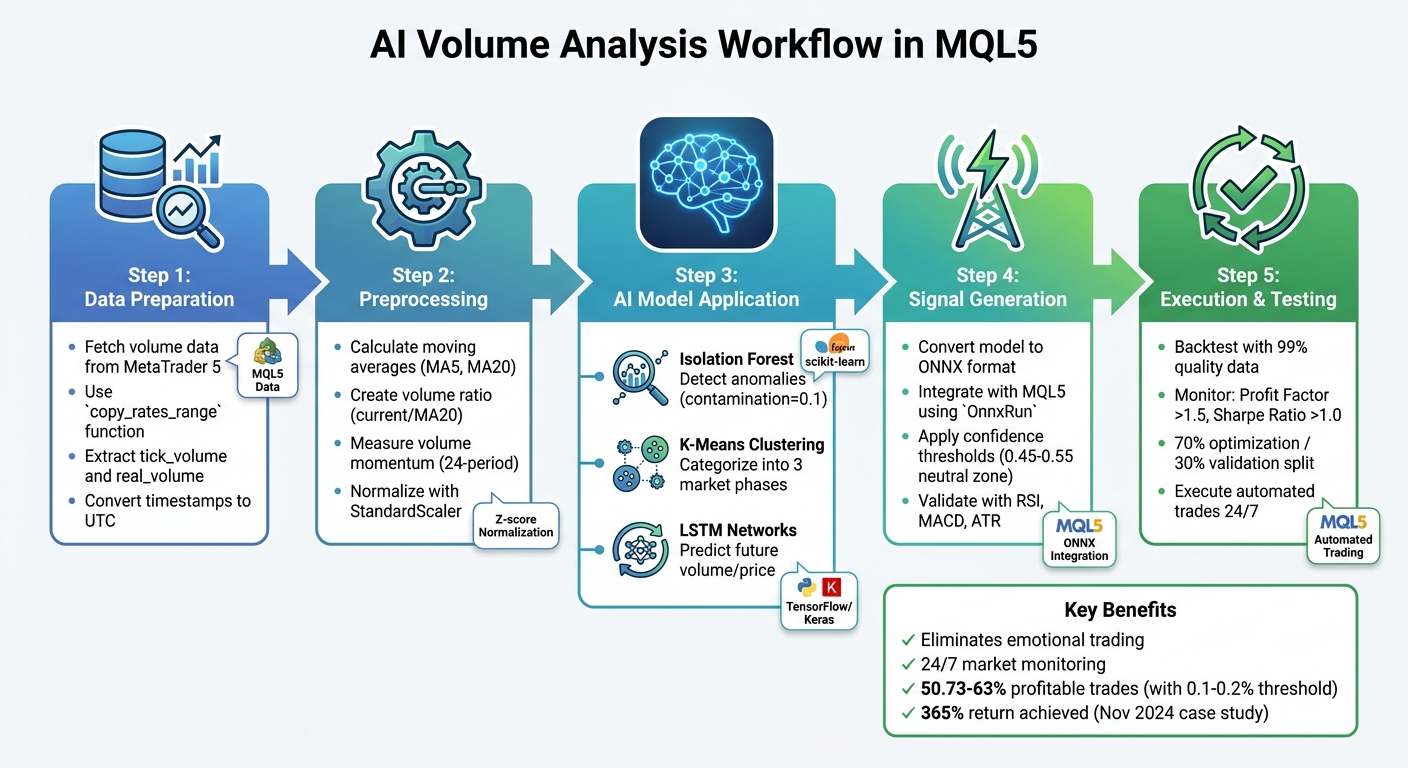
AI-Driven Volume Analysis Workflow in MQL5: From Data to Trading Signals
Preparing Volume Data for AI Analysis in MQL5
Building on the basics of volume analysis, the next step involves preparing the volume data for AI processing. MetaTrader 5 provides both tick and real volume, ensuring comprehensive coverage of activity in both centralized and decentralized markets.
Fetching Volume Data from MetaTrader 5

To extract volume data accurately, the MetaTrader5 Python package serves as a bridge between MQL5 and AI workflows. When pulling historical data, it's better to use the copy_rates_range function rather than copy_rates_from. Why? It ensures that periods with zero volume in illiquid instruments are included, offering a more complete dataset for analysis. This function returns a numpy array with named columns like tick_volume and real_volume, which can then be converted into a pandas DataFrame for further manipulation.
One important detail: MetaTrader 5 timestamps its bar open times in UTC, while Python defaults to local time. To avoid mismatched timestamps, use the pytz library to create UTC-based datetime objects.
Once the data is extracted and time-aligned, it’s ready for preprocessing and feature engineering.
Preprocessing Volume Data for Analysis
Raw volume data often fluctuates significantly, which makes it challenging to analyze directly. Transforming this raw data into meaningful features is a critical step. Start by calculating moving averages - such as a 5-period (vol_ma5) and 20-period (vol_ma20) moving average - using pandas' rolling mean function. These averages help smooth out noise and reveal underlying trends.
Next, create a volume ratio (vol_ratio) by dividing the current volume by vol_ma20. This highlights sudden spikes compared to the average.
To measure volume momentum, apply the pct_change() method across a 24-period window. Additionally, examine the price–volume relationship by calculating rolling correlations. For AI models like LSTM or Isolation Forest, normalizing the data with StandardScaler (Z-score normalization) or using a logarithmic transformation can help manage irregular volume spikes effectively.
As developer Yevgeniy Koshtenko points out:
Machine learning in trading is not a magic pill. Success comes only with a deep understanding of the market and careful engineering of features.
sbb-itb-3b27815
Applying AI Models for Volume Analysis
Once your volume data is prepped and scaled, AI models can help uncover patterns that might otherwise go unnoticed. Two standout models for this task are Isolation Forest, which is great for spotting unusual trading activity, and K-Means, which categorizes volume into distinct market states. Together, they offer a solid approach to understanding market volume behavior.
Detecting Volume Anomalies with Isolation Forest
The Isolation Forest model is excellent for identifying local volume spikes - those that deviate from the surrounding data rather than just extreme values. As developer Yevgeniy Koshtenko puts it:
Classical methods like z-scores or percentile scores can miss a local anomaly... what is important is not the absolute or percentage values, but the volumes that stand out from the rest - and are out of the general context.
This approach integrates seamlessly with tools like MetaTrader 5 for data fetching and trade execution, while Python frameworks like Flask or FastAPI handle the machine learning backend. The process involves MQL5 transferring OHLCV sequences to the Python backend using WebRequest(), which then returns real-time anomaly flags.
Key features used in this model include:
real_volumevol_ratio: The current volume divided by the 20-period moving averagevolume_volatility: Standard deviation of volume percentage changes
These features should be normalized with StandardScaler to prevent scaling issues. For the contamination parameter, a value of 0.1 (10%) is recommended, which accounts for the noisiness of real-world markets - adjusting from the typical 0.05.
While anomaly detection is powerful on its own, combining it with clustering methods enhances the ability to classify market conditions.
Clustering Volume Data with K-Means
K-Means clustering goes beyond spotting anomalies by grouping volume data into distinct market states. Typically, this results in three clusters: "background/accumulation", "run/movement", and "extreme movement". These classifications help traders determine whether the current activity reflects normal accumulation, a trending market, or an unusual surge.
The algorithm works iteratively: starting with random cluster centers, it calculates distances between data points and centers, assigns points to the nearest cluster, and recalculates the centers by averaging the assigned points. This cycle continues until the clusters stabilize.
For optimal performance, MQL5 developers leverage OpenCL to speed up calculations. Kernels like KmeansCulcDistance, KmeansClustering, and KmeansUpdating handle parallel distance computations. Just like with anomaly detection, normalizing volume features with StandardScaler is critical to avoid bias in distance calculations.
When applied effectively, K-Means clustering has shown that 50.73% to 63% of trades can be profitable when using a predicted return threshold of 0.1% to 0.2%. The real edge comes from combining cluster data with anomaly flags - when an anomaly aligns with a specific cluster, it significantly boosts the accuracy of predicting price movements.
Training and Integrating AI Models in MQL5
Training LSTM Models for Volume Analysis
When training an LSTM model for volume data analysis, selecting the right features and keeping the architecture straightforward are crucial to avoid overfitting. Some of the key features to include are:
- Volume moving averages (e.g., MA5 and MA20)
- Volume ratios (current volume divided by MA20)
- Volume momentum (percentage change over 24 bars)
- Volume volatility (measuring fluctuations over time)
For more advanced setups, you might add first and second derivatives to capture changes and acceleration in volume patterns.
A standard architecture for this type of model typically includes two LSTM layers with 64 units each, a dropout layer set at 20% to reduce overfitting, and a final linear dense layer. Data normalization, as described in the "Preprocessing Volume Data for Analysis" section, is a critical step. Labels can be assigned as follows:
- 1 (Buy): Future price movement exceeds a set threshold (e.g., 0.1%)
- -1 (Sell): Future price movement falls below the threshold
- 0 (Hold): No significant price movement
For effective temporal analysis, use a sequence length of 30 to 50 historical bars.
One example of success with this approach comes from November 2024, when algorithmic trader Yevgeniy Koshtenko developed an LSTM-based system for Sberbank (SBER) shares. His model, which used two LSTM layers with 64 neurons each, achieved a 365% return, with 50.73% of trades being profitable. The simplicity of the architecture helped reduce noise and improve performance.
Once the LSTM model is trained, the next step is integrating it into MQL5 to generate actionable trading signals.
Generating and Executing Trading Signals in MQL5
After training your LSTM model in Python using TensorFlow or Keras, convert it to the ONNX format for seamless integration with MQL5. The ONNX file can then be embedded into your Expert Advisor using the #resource directive. Functions like OnnxCreateFromBuffer and OnnxRun handle the execution of the model within MQL5.
To ensure consistency, normalize live market data in MQL5 using the same parameters (e.g., min, max, scale) applied during training. Saving these parameters to a CSV or header file can streamline this process. For binary trading outcomes, a sigmoid activation function in the final layer outputs a probability between 0.0 and 1.0. Setting a "neutral zone" (e.g., 0.45 to 0.55) helps filter out low-confidence signals. Many professional traders enhance AI predictions by combining them with additional indicators like RSI, MACD, or ATR for validation.
A notable example of this integration is the "Ratio X Gold ML (ONNX)" Expert Advisor, developed by Mauricio Vellasquez in November 2025. This system uses a pre-trained LSTM model (converted to ONNX) to generate trading signals for gold across multiple timeframes (M1 to H4). These signals are further refined using conditions such as:
- Spread limits
- RSI (above 55 for buy signals)
- MACD alignment
- ADX (above 20)
Mauricio Vellasquez shared his philosophy on combining AI with trading expertise:
"I don't want an EA that just relies on a blind prediction... A model trained on historical data might say 'BUY,' but as a trader, I know that signal is worthless if the spread is 100 pips, volatility is zero, or a major trend on a higher timeframe is screaming 'SELL'."
This approach showcases how AI can be used to turn volume analysis into automated, real-time trading decisions within MQL5. When implementing these systems, always include error handling for functions like OnnxRun or WebRequest. Checking for issues such as INVALID_HANDLE or failed return codes can help avoid executing trades based on faulty or missing predictions.
Backtesting and Optimizing Volume Strategies with Traidies

After setting up AI-driven volume analysis, the next logical step is to fine-tune and validate these strategies for better performance.
Using Traidies AI Strategy Parser
Traidies simplifies the process of turning your strategy ideas into executable code through its AI Strategy Parser. For instance, you can describe your strategy in plain English - like "buy when current volume exceeds the 5-period average by 20% and price closes above the open" - and the platform instantly generates the corresponding MQL5 code.
To start, use pseudocode as a bridge between your strategy’s concept and its implementation. As one MQL5 developer puts it:
Pseudocode acts as a link between concrete code implementations and abstract algorithmic concepts. Before starting to code, it enables us to quickly and easily sketch out our ideas in a format that humans can read.
This method helps break down your objectives into smaller, actionable tasks - like initializing variables, monitoring volume spikes, or setting alert triggers - before the AI generates the final code.
Once the code is produced, review it carefully. Treat AI-generated code as a starting point, refining it manually to ensure accuracy and reliability. Engage with the AI iteratively by asking targeted questions based on your pseudocode, such as "What variables are essential for volume normalization?" For volume-based strategies, ensure raw volume data is processed effectively, such as by using a logarithmic or normalized transformation. This creates a consistent "Volume Boundary" across varying market conditions.
Backtesting Volume EAs with Historical Data
After generating your MQL5 code, Traidies provides tools for backtesting your strategies using historical data. You can access this data through MQL5’s Volume[] array or CopyVolumes() function.
When analyzing backtesting results, focus on key performance metrics. These include:
- Profit Factor: A value over 1.5 (gross profit divided by gross loss) indicates profitability.
- Sharpe Ratio: Above 1.0 signals good risk-adjusted returns.
- Recovery Factor: Exceeding 2.0 (net profit divided by maximum drawdown) reflects strong recovery potential.
To ensure accuracy, use 99% modeling quality data to avoid gaps that might distort results. Additionally, include realistic spreads - such as 1.5 pips for EURUSD - to ensure the backtesting outcomes align with live trading conditions.
A reliable approach is to split your historical data into 70% for optimization (in-sample) and 30% for validation (out-of-sample or forward testing). This minimizes the risk of overfitting to specific volume patterns that may not hold up in real-world scenarios. Developer Javier Santiago Gaston De Iriarte Cabrera emphasizes this:
I strongly recommend to do a big optimization for each pair.
His work on EURUSD and GBPUSD during late 2024, using 30-minute timeframes, highlights the importance of optimizing strategies for each currency pair individually.
Well-executed backtesting not only sharpens strategy performance but also ensures that your automated volume strategies are ready for live trading. This detailed process strengthens the reliability of your approach and prepares it for practical application in the market.
Conclusion
Automating volume analysis in MQL5 with AI can reshape trading strategies by streamlining processes like data fetching, preprocessing, and model integration. It all begins with pulling volume data from MetaTrader 5 and preparing it through techniques like normalization or logarithmic transformations. These steps ensure the AI model receives consistent and meaningful inputs for analysis. From there, LSTM networks dive into historical OHLCV data, identifying patterns and triggering automated trading signals through your Expert Advisor.
This approach eliminates emotional decision-making and ensures 24/7 market monitoring. As Hlomohang John Borotho, Founder and CEO of GIT Capital, puts it:
Incorporating an AI model into an MQL5 trading strategy can help overcome existing challenges by infusing machine learning-based adaptability and decision-making capabilities.
This flexibility allows trading systems to adapt to market shifts that rigid, indicator-based methods often fail to capture.
Tools like Traidies make this process even easier. By letting users describe strategies in plain English, it generates MQL5 code instantly and runs automated backtests with historical data. This not only speeds up development but also reduces coding errors, making AI-driven volume analysis more accessible - even for traders without a programming background.
To get started, keep it simple: use modular code, focus on high-volume trading periods, and backtest under realistic conditions. Pairing AI models with traditional indicators like ADX or OBV can also help filter out noise and confirm signals.
FAQs
Tick volume vs. real volume - which should I use?
Tick volume tracks the number of price changes within a specific time frame, serving as an alternative to actual volume data when the latter isn’t available. On the other hand, real volume represents the exact number of contracts or shares traded, providing a clearer picture of market activity. Whenever possible, rely on real volume for more precise insights. However, in markets like forex, where real volume data is often unavailable, tick volume offers a practical substitute for gauging trading activity.
How do I avoid time zone mismatches in MT5 volume data?
To prevent time zone mismatches in MT5 volume data, make sure your platform and analysis align with the correct time zone settings. Adjust the time zone in your MT5 platform or any custom scripts to match your trading hours or the time zone of your data source. This alignment is crucial for maintaining consistency in volume analysis and avoiding mistakes caused by conflicting time references.
How do I run a Python-trained LSTM model inside an MQL5 EA?
To integrate a Python-trained LSTM model into an MQL5 Expert Advisor (EA), you’ll need to establish real-time communication between Python and MQL5 using socket programming. Here's how you can approach it:
-
Train and Save the Model in Python: First, train your LSTM model in Python using a library like TensorFlow or PyTorch. Once trained, save the model to a file (e.g.,
.h5format for TensorFlow) so it can be loaded later for predictions. - Set Up a Python Socket Server: Create a Python script that acts as a socket server. This server will load the saved LSTM model and listen for incoming data from the MQL5 client. When it receives data, it will process it through the model and return predictions.
-
Implement a Socket Client in MQL5: Write the MQL5 code to act as a client. This client will send market data (or any required inputs) to the Python server and receive the predictions. Use the
SocketConnectandSocketSendfunctions in MQL5 to handle this communication. - Use Predictions in Your EA: Once the MQL5 client receives predictions, integrate them into your EA logic to automate trading decisions, such as opening or closing positions based on the model's output.
By combining Python's machine learning capabilities with MQL5's trading framework, you can create a more dynamic and data-driven trading strategy.