AI vs Manual Support and Resistance Analysis
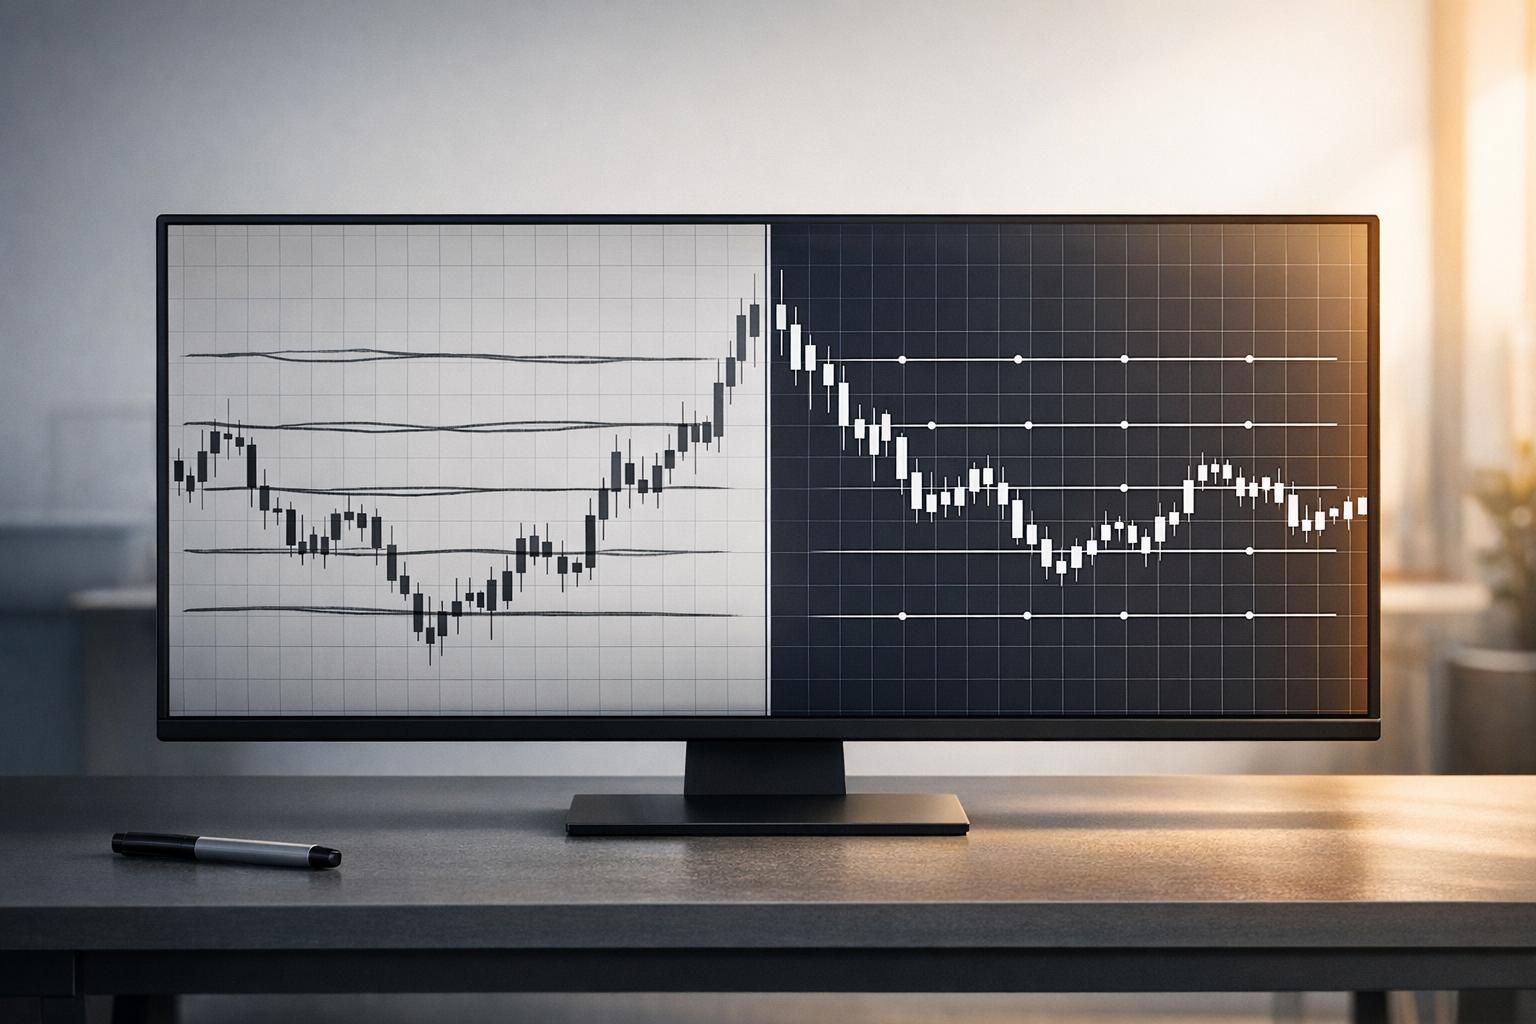
AI vs Manual Support and Resistance Analysis
AI vs. Manual Support and Resistance Analysis: Which is Better for Traders?
Support and resistance levels are key for predicting price movements in trading. Traders use these levels to set stop-losses, identify reversals, and plan entries or exits. But how should you determine them - manually or with AI?
- Manual Analysis: Relies on visual identification of price zones (e.g., swing highs/lows, round numbers, moving averages). It’s flexible but subjective, time-consuming, and prone to inconsistencies.
- AI Analysis: Uses algorithms to scan data, detect patterns, and assign confidence scores to levels. It’s fast, objective, and scalable but depends on data quality and can lack transparency.
Key Takeaways:
- Manual methods are better for understanding market context but require expertise and time.
- AI excels in speed, consistency, and handling large datasets across multiple assets.
- A hybrid approach combining AI’s efficiency with human oversight often works best.
Quick Comparison:
| Metric | Manual Analysis | AI Analysis |
|---|---|---|
| Speed | Hours per asset | Seconds for thousands of assets |
| Accuracy | Varies by trader experience | 80–90% with statistical validation |
| Scalability | Limited to a few assets | Tracks hundreds/thousands easily |
| Objectivity | Subjective, prone to bias | Consistent and rule-based |
| Cost | Time-intensive | $15–$250/month for tools |
AI removes much of the guesswork, but human traders are still needed for interpreting unexpected events or market shifts. Combining both methods ensures a balanced, effective trading strategy.
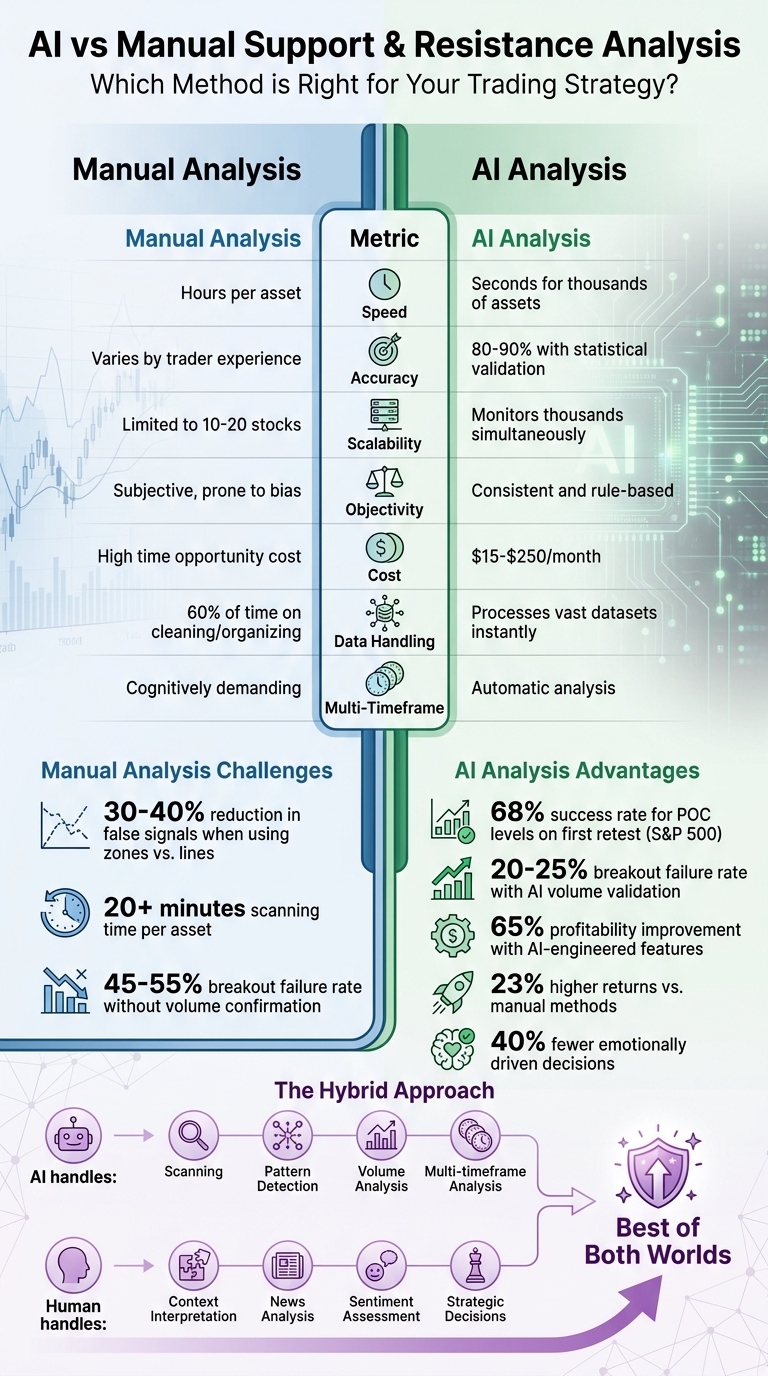
AI vs Manual Support and Resistance Analysis: Complete Comparison for Traders
How to Train an AI Agent to do Trading Based on Support Resistance Signals
sbb-itb-3b27815
Manual Support and Resistance Analysis
Manual analysis depends on a trader's ability to visually pinpoint price zones where buying or selling pressure has historically caused reversals. This traditional method is a cornerstone of technical analysis, but it requires both time and expertise. Over the years, these foundational practices have branched into specific techniques, each with its own strengths and weaknesses.
Common Manual Analysis Techniques
One widely used method is identifying horizontal levels. Traders look for swing highs and swing lows - key points where the market has reversed at least twice. While two touches suggest a potential level, three touches confirm it as more reliable.
Trendlines are another popular tool. These are drawn by connecting consecutive higher lows in an uptrend (diagonal support) or lower highs in a downtrend (diagonal resistance). Psychological round numbers - like $50, $100, or $500 - often act as natural barriers because many traders cluster their limit orders around these milestones. Moving averages, particularly the 50-day and 200-day simple moving averages (SMA), also serve as dynamic support or resistance levels.
Experienced traders often use multiple timeframe analysis. This involves marking major levels on higher timeframes (like weekly or daily charts) and then switching to shorter ones (hourly or 5-minute charts) to find overlapping areas. Such confluences strengthen the importance of these zones. Volume clusters, which indicate areas of intense trading activity, can also highlight zones of strong institutional interest. Another technique is role reversal, where a broken resistance level becomes new support, and vice versa. Fibonacci retracements at levels like 38.2%, 50%, and 61.8% are also commonly used to mark horizontal zones where prices might pause during a pullback.
"The best support and resistance analysis is the one with the fewest lines that explain the most price action." - Alek Blom, Developer and Entrepreneur
A practical tip for manual analysis is to draw zones instead of precise lines. Using narrow rectangles - roughly 0.5% to 1% wide - acknowledges that prices rarely reverse at the exact same level each time. This method can reduce false signals by 30–40% in live trading.
Even with these well-established techniques, manual analysis comes with certain drawbacks.
Drawbacks of Manual Analysis
One of the biggest challenges is subjectivity. Different traders may draw entirely different levels on the same chart, leading to inconsistent decision-making and making it hard to replicate results across varying market conditions. This inconsistency can also interfere with backtesting and increase emotional bias, as traders might adjust levels to justify a trade.
Manual analysis is also time-intensive. Scanning charts across multiple timeframes can take 20 minutes or more per asset. Overloading a chart with too many levels creates clutter, which can delay decisions when quick action is needed.
Precision can be another pitfall. Treating support and resistance levels as exact price points rather than zones increases the risk of being stopped out by normal market noise or missing trades when prices don’t hit the precise level. Additionally, static levels can quickly become irrelevant in fast-moving markets if traders fail to update them regularly.
| Challenge | Impact on Trader |
|---|---|
| Subjectivity | Inconsistent levels complicate backtesting |
| Chart Clutter | Slower decision-making during critical moments |
| Exact Price Bias | Leads to more false signals and stop-outs |
| Manual Calculation | Delays reactions to market changes |
| Single Timeframe Focus | Misses broader institutional activity |
These limitations underline the need for more efficient tools. Up next, we’ll examine how AI-powered methods tackle these challenges head-on.
AI-Powered Support and Resistance Analysis
AI has completely changed how we approach support and resistance analysis. Instead of manually drawing lines on charts, algorithms now scan thousands of price bars in seconds, identifying patterns and key price zones. For instance, machine learning models analyze historical data to pinpoint areas where buying and selling pressures have consistently appeared. Techniques like K-Means clustering group historical price touchpoints into distinct zones, while volume-weighted analysis highlights price levels with the most institutional trading activity.
One standout AI technique is the identification of the Point of Control (POC) - the price level with the highest traded volume. Research shows that in the S&P 500, POC levels act as support or resistance 68% of the time on the first retest. AI also applies weight decay functions, prioritizing recent support levels over older ones. This dynamic approach ensures that support and resistance zones evolve alongside market conditions, offering traders a more adaptable toolset.
AI Methods for Level Detection
AI tools use a variety of advanced methods to detect support and resistance levels with precision. For example:
- Multi-timeframe confluence: This method scores levels that align across daily, weekly, and monthly charts, highlighting the most critical price barriers.
- Volatility adaptation: By using the Average True Range (ATR), AI adjusts the thickness of support and resistance zones. These zones expand during volatile periods and contract when markets are calm.
- Automated strength ranking: AI evaluates levels based on factors like the number of historical tests, trading volume, and the size of previous price rejections.
Additionally, AI can process up to 5,000 historical price bars in seconds, uncovering statistical structures that might be invisible to manual analysis.
"Machine learning is all about machine looking at the data and telling us the relationships exist. I didn't want to describe how to define a support and resistance levels." - judopro, Author
AI goes beyond static horizontal lines by detecting dynamic levels, such as trend-based levels, anchored VWAPs, and moving average clusters. In fast-paced markets like cryptocurrency, AI recalculates support and resistance levels every few seconds to reflect real-time liquidity changes and order-book shifts. These capabilities give traders a significant edge in adapting to ever-changing market conditions.
Advantages of AI-Based Analysis
The speed of AI analysis is unmatched. While manual charting might take 20 minutes per asset, AI can scan entire portfolios in seconds. This efficiency allows traders to monitor dozens - or even hundreds - of securities simultaneously without missing key opportunities. Plus, AI removes the subjectivity of manual analysis, ensuring consistent results. Two traders using the same AI tool will get identical outputs, making backtesting and strategy replication far more reliable.
One of AI's greatest strengths is its ability to make objective, data-driven decisions. For example, integrating AI-engineered support and resistance features into a machine learning model improved profitability by 65% across eight currency pairs compared to models without these features. AI processes data without bias, relying solely on statistical probabilities.
Another advantage is AI's continuous volume verification. While 45–55% of breakouts fail within five days without volume confirmation, AI-validated breakouts - with a 2× volume surge - reduce the failure rate to just 20–25%. By constantly checking volume thresholds, AI filters out false breakouts that might mislead manual traders.
AI Analysis Limitations
Despite its strengths, AI does have limitations. Overfitting is a significant concern - if the cluster count is set too high, the algorithm might mistake random noise for meaningful patterns, resulting in unreliable levels. Techniques like the Elbow Method can help optimize cluster counts, but they require careful calibration.
The quality of data is another critical factor. AI is only as good as the information it processes. Issues like data gaps, inaccurate volume figures, or incomplete price histories can lead to flawed results. Unlike human traders, AI applies the same logic to all data, which can be problematic when the data itself is unreliable.
Finally, AI's decision-making process can sometimes feel opaque. While manual traders can explain why they placed a level at a specific price, AI-generated levels may lack clear reasoning. However, ongoing advancements are gradually improving the transparency of AI-driven decisions.
AI vs Manual Methods: Side-by-Side Comparison
AI and manual analysis take fundamentally different approaches to trading. Manual charting often relies on the trader’s interpretation, which can vary significantly from person to person. For instance, two traders might draw entirely different levels on the same chart, making the process inherently subjective. On the other hand, AI operates using consistent mathematical frameworks, such as unsupervised clustering, ensuring results that can be replicated reliably. This consistency becomes especially critical when backtesting strategies or trying to replicate a trading system.
Another major distinction lies in speed. Manually scanning through charts can take hours - or even days - while AI can identify patterns in mere seconds. Plus, AI eliminates much of the grunt work like cleaning and organizing data, letting traders focus on making strategic decisions instead of slogging through raw information.
"AI is not ending equity research. It is forcing it to grow up. The old model rewarded effort. The new model rewards judgment." - The WallStreet School
Scalability is another area where AI pulls ahead. Manual traders often struggle to monitor more than 10–20 stocks effectively, limited by time and cognitive bandwidth. In contrast, AI systems can track thousands of assets simultaneously and in real time. Additionally, studies indicate that AI-driven trading strategies deliver 23% higher returns and result in 40% fewer emotionally driven decisions compared to traditional manual methods.
Here’s a quick breakdown of how the two methods compare:
Performance Comparison Table
| Metric | Manual Analysis | AI-Powered Analysis |
|---|---|---|
| Speed | Hours to days for comprehensive scanning | Seconds; processes thousands of bars instantly |
| Accuracy | Subjective; prone to human error and bias | 80–90% accuracy with statistical validation |
| Scalability | Limited to 10–20 stocks | Monitors thousands of assets simultaneously |
| Objectivity | Varies by trader experience | High; applies consistent algorithmic rules |
| Multi-Timeframe | Cognitively demanding; requires manual comparison | Automatic; analyzes multiple timeframes instantly |
| Data Handling | 60% of time spent cleaning/organizing data | Processes vast datasets instantly |
| Cost | High opportunity cost of time | $15–$250/month subscription fees |
Practical Applications and Traidies Integration
AI-powered support and resistance analysis brings real advantages to trading. By automating level detection, AI saves traders from countless hours of manually scanning charts. It identifies demand and supply zones across hundreds of assets in mere milliseconds, operating continuously - 24/7. Additionally, AI-calculated volume-weighted strength reduces false breakout rates significantly. For example, when breakouts happen with twice the average 20-day volume, false breakouts drop to 20-25%, compared to 45-55% without this volume confirmation. AI also tracks dynamic levels like moving averages and Fibonacci retracements, adjusting as market conditions shift.
Backtesting adds another layer of practicality. By analyzing historical data, AI can quickly evaluate how well a strategy might perform. It examines past price behavior at key zones to estimate breakout probabilities, weighing the chances of a price reversal against a decisive breakout based on volume trends and success rates. For instance, research shows that Point of Control levels - prices with the highest traded volume - held as support or resistance 68% of the time on their first retest in the S&P 500. These applications connect theoretical insights with tangible results for traders.
How Traidies Supports Traders
Traidies enhances trading by building on AI's strengths. While manual and AI-driven methods each have their place, Traidies leverages AI to address the limitations of manual trading. The platform simplifies strategy creation, allowing traders to use plain English instead of writing complex MQL5 code. For example, a command like "Identify support levels for the past 90 days" is automatically converted into functional MQL5 code by the platform.
One standout feature is its ability to handle multi-timeframe logic, which is notoriously hard to code manually. Traders can pinpoint support and resistance zones on weekly or daily charts, then execute trades based on short-term signals - like a "Change of Character" on a 5-minute chart - without needing to write any code. Automated backtesting further streamlines the process, offering quick insights into how strategies would have performed in the past. As Jackson Murphy puts it:
"A robot doesn't get scared when price moves quickly, it doesn't get greedy after a win, and it doesn't rage-click after a loss. If you tell it to follow a rule, it will follow that rule exactly, every single time".
This hybrid approach allows AI to handle repetitive tasks like scanning and execution, while traders focus on interpreting market context and sentiment. It’s a combination of algorithmic accuracy and human intuition that enhances overall trading performance.
Conclusion: Selecting the Right Method
Choosing between AI and manual support and resistance analysis comes down to balancing human intuition against AI's speed and precision. Manual analysis shines when it comes to understanding context. For example, during geopolitical crises or unexpected announcements from central banks, human traders can interpret the reasons behind price movements and adapt their strategies accordingly. On the other hand, AI excels in speed, consistency, and scale. It can analyze thousands of assets in milliseconds, perform volume-weighted calculations without bias, and execute trades based on predefined rules.
Studies show that AI can deliver an accuracy rate of 80–90% and reduce false breakouts to 20–25% when volume confirmation is used. However, AI has its limitations. It may struggle with unprecedented situations, like market regime shifts or black swan events, where historical data offers little guidance and human intuition becomes essential.
To address these strengths and weaknesses, many traders are now adopting a hybrid approach. This strategy combines the efficiency of AI with the judgment of human traders. AI takes on the heavy lifting - such as identifying key levels across multiple timeframes, monitoring dozens of securities simultaneously, and spotting zones where weekly and daily support levels overlap. Meanwhile, traders validate these findings by considering news, sentiment, and the broader market environment. As Mark Angelo D. Julian, Danilo B. Villarino, and Kristine T. Soberano explain:
"Although humans excel at understanding context, computers are far superior in processing speed, data accuracy, and performing repetitive calculations".
Platforms like Traidies make this integration seamless. By translating plain English commands into functional MQL5 code and automating backtesting, Traidies allows traders to harness AI's capabilities without losing control. Traders define the strategy, while AI handles scanning, testing, and execution - freeing them to focus on decisions that require a human touch.
This combined approach merges AI's precision and speed with human oversight, creating a strategy that leverages the best of both worlds.
FAQs
How do I know if an AI support/resistance level is reliable?
Support and resistance levels generated by AI gain credibility when certain factors align. For instance, repeated testing of these levels, high trading volume around them, and precise price reactions - like bounces or reversals - can indicate their dependability. Their trustworthiness increases further when grounded in historical data and supported by statistical analysis.
What data do AI tools need to find support and resistance correctly?
AI tools rely on a combination of historical price data, volume information, and pattern recognition metrics to pinpoint support and resistance levels. By analyzing past trends and market behavior, these tools can accurately identify critical price points with precision.
How can I combine AI levels with my own chart analysis without overtrading?
To steer clear of overtrading, consider AI-generated support and resistance levels as guidelines rather than absolute directives. Combine these insights with your own analysis of trends, price movements, and trading volume. Before entering a trade, look for solid confirmation through factors like candlestick patterns or momentum indicators. By staying disciplined, you can take advantage of AI’s unbiased perspective while still keeping control of your strategy. This balanced approach minimizes over-reliance on AI and helps curb impulsive trading decisions.