Building Predictive Models in MQL5

Building Predictive Models in MQL5
Predictive models in trading analyze historical market data to forecast future behavior. Using MQL5, you can create these models directly on the platform, leveraging its tools for data preparation, model building, and integration with trading systems. Here's a quick breakdown:
- Predictive Models: Regression models predict continuous values (e.g., price), while classification models forecast categories (e.g., price up or down).
- Why MQL5?: MQL5 supports tools like
matrixandvectorfor data handling, ONNX format for importing Python-trained models, and real-time broker API integration. - Key Steps:
- Structure and prepare market data using
CopyRates()and normalize it for consistency. - Engineer features like relative price measures and technical indicators.
- Build models (e.g., linear regression, logistic regression) using MQL5’s Matrix API or import advanced models from Python.
- Evaluate models using metrics like R², RMSE, and accuracy.
- Test strategies with walk-forward validation and backtesting.
- Structure and prepare market data using
MQL5 simplifies the process of turning predictive models into actionable trading strategies, enabling efficient data handling, model execution, and trade automation.
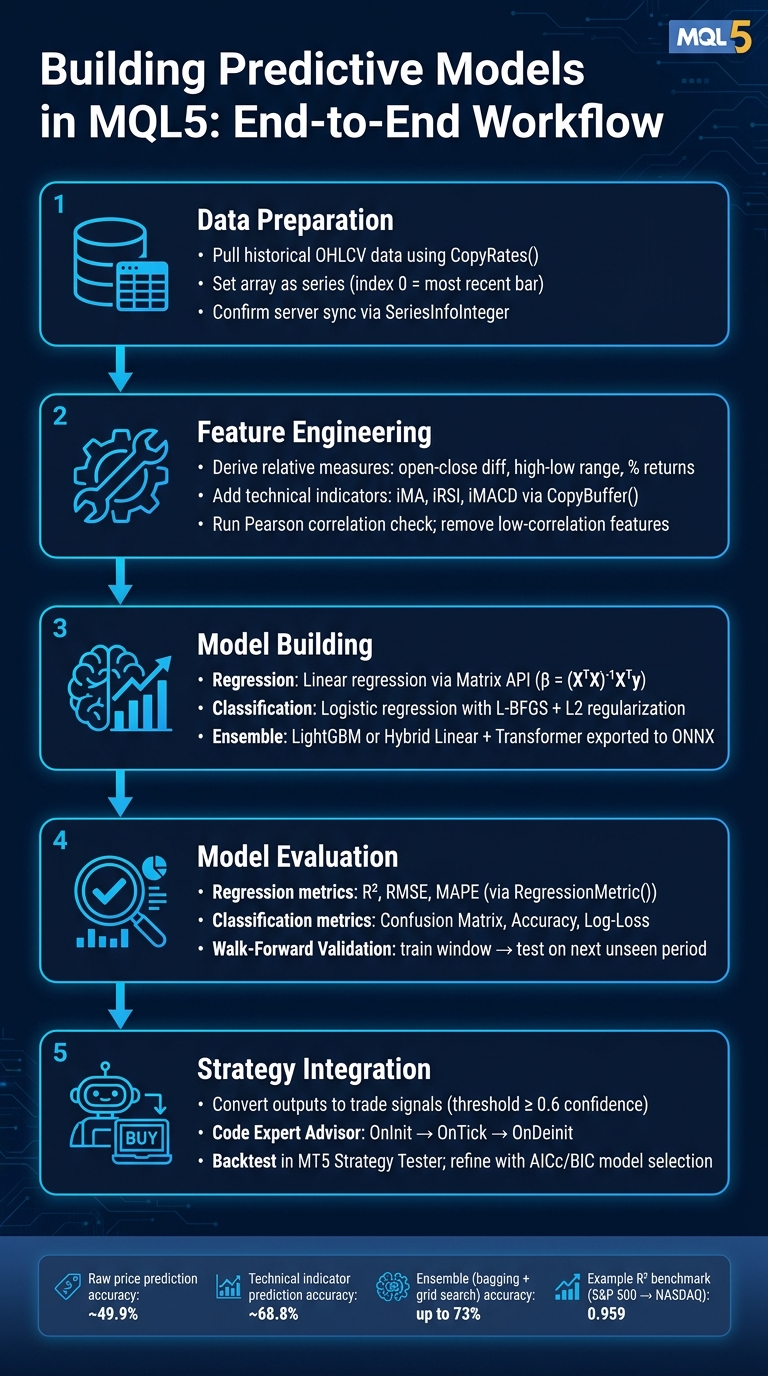
Building Predictive Models in MQL5: End-to-End Workflow
Preparing Market Data for Predictive Modeling
Structuring Data in MQL5
The backbone of any predictive model is well-organized and clean data. In MQL5, the CopyRates() function is your go-to tool for pulling historical OHLCV data into an array of MqlRates structures. Each element in this array contains essential details for a single bar: opening time, open, high, low, close, tick volume, spread, and real exchange volume.
Quick Tip: By default, MQL5 arrays are indexed from oldest to newest. To make index 0 represent the most recent bar, you need to set the array as a series using:
ArraySetAsSeries(rates, true);
Before copying data, ensure your terminal is fully synchronized with the trade server. Use SeriesInfoInteger with the SERIES_SYNCHRONIZED modifier to confirm that all historical data is available and up to date.
Once your data is structured, you can move on to creating features that will enhance your model's predictive power.
Building Features for Predictive Models
OHLC prices are inherently non-stationary. To make them more useful for modeling, focus on relative measures like the open-close difference, high-low range, or percentage returns. These derived features are easier to compare across different price levels and timeframes.
Adding technical indicators can also improve your model. Functions like iMA, iRSI, or iMACD allow you to create indicator handles and extract their values into a double array using CopyBuffer(). This ensures that the indicator values align perfectly with the corresponding bars. Studies show that predicting changes in indicator values often leads to better accuracy than directly forecasting raw price changes. As algorithmic trader Gamuchirai Zororo Ndawana explains:
"Forecasting changes in indicator values is more effective than predicting security price changes... because we can fully observe all the factors affecting the value of a technical indicator."
Before finalizing your feature set, run a Pearson correlation check between each feature and your target variable. Features with little to no correlation can introduce unnecessary noise and should be excluded.
Once your features are ready, the next step is defining and normalizing your training targets.
Defining and Normalizing Training Targets
After crafting your features, it's time to define the target variables your model will predict. Targets can be:
- Regression targets: Continuous values, such as the closing price 10 bars ahead or the magnitude of a price change.
- Classification targets: Categorical labels, such as
1(price goes up) or0(price goes down).
Once targets are defined, normalize your features to ensure they align with the model's requirements. Two common methods are:
- Z-score normalization: Subtract the mean and divide by the standard deviation. In MQL5, the
matrixtype simplifies this process usingmatrix::Meanandmatrix::Std. - Min-max scaling: Map values to a range of 0–1. This method works particularly well for neural network-style models.
"Data preparation is an MQL5 task. It is in the terminal that features are formed, normalization is performed and, if necessary, PCA is applied to reduce the dimensionality of data and remove correlated noise."
If you're using a regression model that assumes stationarity (like ARIMA), apply differencing. This involves subtracting each value from the previous one to stabilize the mean and variance of your series before training.
sbb-itb-3b27815
Implementing Predictive Models in MQL5
Building a Linear Regression Model
Once you've structured your market data and engineered the necessary features, it's time to dive into predictive modeling. Linear regression is a logical first step. It's straightforward, quick, and great at identifying specific market patterns.
To implement this in MQL5, the Matrix API is your go-to tool. Functions like matrix::MatMul and matrix::Inv help calculate the design matrix with an intercept and solve the equation β = (XᵀX)⁻¹Xᵀy. As MQL5 developer Gamuchirai Ndawana explains:
"The Matrix and Vector MQL5 API offers us powerful tools for building modern machine learning applications. But to realize the potential of the API, you must appreciate the basic linear algebra rules."
This method ensures your code remains compact, maintains consistent backtesting speed, and minimizes floating-point errors. Keep an eye on your model's R² value (coefficient of determination). If it's close to 0, the model isn’t capturing the data well. On the other hand, a value near 1 indicates a strong fit. For instance, one benchmark using S&P 500 data to predict NASDAQ values achieved an impressive R² of 0.959, explaining over 95% of the variance.
"Building a linear model with non-linear related data is a huge fundamental mistake; be careful!" - Omega J Msigwa, Machine Learning Expert
Linear regression provides continuous predictions, but when the focus shifts to trade direction, classification models take center stage.
Classifying Trade Direction
If your goal is to predict whether prices will move up or down, classification models are the way to go. Logistic regression is a simple yet effective choice in MQL5. It outputs a probability between 0 and 1, representing the likelihood of an upward price movement. Binary labels can be defined as 1 for upward moves and 0 for downward moves.
Training this model involves optimizing the negative log-likelihood (NLL) loss using a numerical algorithm. The Alglib library in MQL5 is particularly useful here, offering the L-BFGS optimization method, which is well-suited for this task. Adding L2 regularization helps prevent overfitting, especially when dealing with noisy market data.
To reduce false signals, set a probability threshold of 0.6 or higher for predictions. Validate your model statistically using the Likelihood Ratio (LR) test, calculated as LR = 2(LLF - LLF₀). Compare this value to the Chi-square critical threshold. If the statistic falls short, your model's predictions might not be meaningfully better than random guessing.
For more complex decision boundaries, consider training a Random Forest classifier in Python. Export the model to ONNX format and execute it in MQL5. This allows you to leverage advanced tree-based models without compromising performance.
Improving Predictions with Ensemble Methods
Once you've built individual models, ensemble methods can take your predictions to the next level. By combining multiple models, you can address the limitations of each and better capture diverse market behaviors.
Gradient Boosting, especially using LightGBM, is a powerful option for financial data. Train the model in Python, export it to ONNX, and load it into your Expert Advisor (EA) to implement ensemble strategies. For example, a July 2024 experiment on EURUSD H1 data used five separate LightGBM ONNX models within one EA. Each model specialized in predicting different future bars, with the second-bar model achieving 55.6% accuracy and the fifth-bar model reaching 53.1% accuracy.
Another approach is the hybrid linear + Transformer architecture. In this setup, a linear module captures trend information, while a Transformer encoder focuses on non-linear dependencies. Their outputs are then combined - often with learnable weights - to produce a final prediction. This is particularly effective because some Transformer models tend to overlook temporal patterns, as shown by experiments where up to 80% of historical data was replaced with zeros, yet performance remained nearly unchanged. Pairing the Transformer with a linear component helps address this issue.
| Ensemble Method | MQL5 Implementation Strategy | Primary Benefit |
|---|---|---|
| Gradient Boosting (LightGBM) | Train in Python, export to ONNX, load in EA | High accuracy for classification/regression |
| Direct Multi-step Ensemble | Multiple specialized ONNX models in an array | Reduces error propagation across forecast horizons |
| Hybrid (Linear + Transformer) | Custom classes combining both layer types | Captures trends and non-linear patterns simultaneously |
If exporting ONNX models feels like a hassle, tools like Traidies can simplify the process. They allow you to describe your strategy in plain language, generate MQL5 code automatically, and run backtests without manually connecting every component.
Getting Started with AI-based Trading robots in MQL5
Evaluating Model Performance in MQL5
Once your models are built, the next step is to evaluate them precisely to refine your trading strategy effectively.
Regression and Classification Metrics
After implementing your models, evaluating their performance is crucial to ensure they work as intended. MQL5 provides built-in vector methods to simplify this process. For instance, you can quickly calculate error metrics using y_pred.RegressionMetric(y_true, REGRESSION_RMSE).
For regression models, the most commonly used metrics include R², RMSE, and MAPE. Here's how they work:
- R²: Indicates how much of the price variance your model explains. A value close to 1.0 is ideal, while values closer to 0 suggest the model isn't fitting the data well.
- RMSE: Expressed in the same units as the target variable, making it straightforward to interpret.
- MAPE: Represents error as a percentage, which is particularly useful when comparing models across assets with varying price scales.
"A metric is an external objective quality criterion, usually depending not on the model parameters, but only on the predicted values." - MQL5 Article 12772
For classification models, such as predicting trade direction, a Confusion Matrix approach is helpful. This involves tracking True Positives (TP), True Negatives (TN), False Positives (FP), and False Negatives (FN), and then calculating accuracy as (TN + TP) / (TP + TN + FP + FN). For example, one MQL5 logistic regression test achieved a training accuracy of 60.577% and a testing accuracy of 64.045%, with log-loss values between 0.64 and 0.68. The small gap between training and testing accuracy suggests the model generalizes well rather than overfitting.
When analyzing results, it's a good idea to use both MAE and RMSE together. If RMSE is significantly higher than MAE, it could indicate the presence of large prediction errors that skew the results.
| Metric | MQL5 Constant | Best Use Case |
|---|---|---|
| Mean Absolute Error | REGRESSION_MAE |
Error measured in actual units (e.g., USD) |
| Root Mean Squared Error | REGRESSION_RMSE |
Identifying sensitivity to price spikes |
| R-Squared | REGRESSION_R2 |
Assessing variance explained by the model |
| Mean Absolute Percentage Error | REGRESSION_MAPE |
Comparing accuracy across different assets |
Walk-Forward Validation for Trading Models
Metrics alone don't guarantee success in live trading. That's where testing strategies like walk-forward validation (WFO) come in. This method provides a more realistic assessment of your model's robustness by simulating how it would perform in real-world scenarios.
The concept is simple: train your model on a fixed historical window, then test it on the next unseen period. For instance, you could train using data from 01/01/2020 to 12/31/2023 and test on data from 01/01/2024 to 12/31/2024. MetaTrader 5's Strategy Tester supports this approach with its Fast and Slow Genetic Optimizers, which can be configured directly in the settings.
"Walk Forward Testing gives us more insights than simple back testing, especially when combined with an optimizer that generates new strategy parameters to test." - Gamuchirai Ndawana
To implement WFO, you'll need to configure these three parameters:
wfo_windowSize: Length of the training/optimization period.wfo_stepSize: Duration of the forward test, which should be shorter than the training window.wfo_stepOffset: Used by the Strategy Tester to iterate through each forward step.
It's important to use a constant lot size during WFO. Varying lot sizes can distort performance estimators and make it harder to compare results across different windows.
"Forward test is calculated as continuation of corresponding optimization run, with parameters optimized only on in-sample data." - Stanislav Korotky
If your dataset is too small for WFO, bootstrap estimation can be a practical alternative. The E632 estimator, for example, balances bootstrap error with apparent training error using a constant of 0.632 (derived from 1 − 1/e), giving a more realistic view of out-of-sample performance.
Reporting Performance Results for U.S. Traders
Clear and consistent result reporting is essential for ongoing optimization. When presenting profits and losses, format them in USD using standard U.S. conventions (e.g., $12,450.75). Dates should follow the MM/DD/YYYY format (e.g., 05/21/2026). You can use MQL5's TIME_DATE flag or custom string formatting to automate this in your output logs.
When logging performance metrics in an Expert Advisor, structure the output to include the metric name, its value, and the date range it covers. This aligns with the standardized format established for your validation windows, ensuring clarity and consistency.
Integrating Predictive Models into Trading Strategies
Turning Model Outputs into Trade Signals
Once your model generates outputs - like predicted prices, probabilities, or labels - you need to translate them into actionable trade signals. This involves setting clear thresholds. For instance, with a Random Forest classifier, you might decide to act only when the model’s confidence surpasses 0.6, triggering a BUY or SELL signal.
For regression models, a common approach is to treat a prediction where the future moving average exceeds the current price as a buy signal. To avoid reacting to market noise during low-momentum periods, normalize these signals by dividing the trend gradient by the market’s standard deviation.
Once you’ve fine-tuned these signals, integrate them into a predictive Expert Advisor (EA) to automate the execution of your trading strategy.
Coding a Predictive Expert Advisor in MQL5
Automating trade signals through an EA involves following a structured approach, which typically includes three core functions:
| EA Function | Purpose |
|---|---|
| OnInit | Loads the model file or ONNX resource, initializes indicators, and sets trade parameters |
| OnTick | Checks for new bars, processes market data, normalizes features, and runs the model for predictions |
| OnDeinit | Releases resources, clears chart objects, and frees indicator handles |
Using MQL5’s data-handling capabilities, the EA processes new bars and executes trades based on your model’s thresholds. A key step in the OnTick function is verifying a new bar using iTime to ensure the model works with completed candlestick data. Once a signal crosses the threshold, you can use the CTrade library to place Buy() or Sell() orders, ensuring PositionsTotal() prevents duplicate trades.
If your model was trained in Python using libraries like scikit-learn or CatBoost, export it to ONNX format for local inference in MetaTrader 5 with the OnnxCreateFromBuffer function. This approach minimizes latency compared to using an external REST API. However, if you opt for an external API, implement a throttling mechanism (e.g., a MinSecsBetweenReq parameter) to avoid overloading the server.
Backtesting and Refining Predictive Strategies
Backtesting in MetaTrader 5's Strategy Tester is a critical step to evaluate whether your model’s historical accuracy translates into real-world profitability. Focus on the equity curve - smooth and steady growth usually signals better generalization than erratic movements with deep drawdowns.
For example, in a trend-following experiment on EURUSD, reducing model training iterations from 1,000 to 100 and applying early stopping after 15 rounds led to a more stable equity curve on unseen data. Overfitting can often produce misleadingly good in-sample results, so a less "perfect" curve that performs well out-of-sample is generally more reliable.
To refine your strategy, consider using the corrected Akaike Information Criterion (AICc) for model comparison. This method penalizes overly complex models and is especially helpful when working with smaller datasets. If your EA is classification-based, adding L2 regularization can prevent large parameter estimates that often indicate overfitting. Additionally, schedule regular retraining - every 12 hours or after a fixed number of bars - to keep the model aligned with changing market conditions.
Platforms like Traidies can simplify this process by converting natural language strategy descriptions into MQL5 code. They also enable automated backtesting with historical data, streamlining the iteration process for different model configurations.
Conclusion: Next Steps for Predictive Model Development in MQL5
Now that we've covered data preparation, modeling, and evaluation strategies, the next phase is all about refining and enhancing performance. Developing a predictive model in MQL5 is just the starting point - its true potential lies in ongoing optimization.
One key improvement is shifting your prediction target. Instead of focusing on raw price changes (which typically yield around 49.9% accuracy), aim for technical indicator values, like a 60-period Simple Moving Average, which can improve accuracy to approximately 68.8%. Strengthen your feature engineering and validation processes by incorporating PCA and testing it with TimeSeriesSplit, which helps ensure your model performs reliably. Before deploying the model, reserve a final unseen data set to simulate real trading conditions and verify its effectiveness.
Once your validation pipeline is solid, the next step is to choose models that strike a balance between complexity and performance. Tools like AICc and BIC can help by penalizing overly complex models, reducing the chances of overfitting while guiding you toward better model selection.
"The BIC and AIC allow us to compare different models and choose the one that best fits our data while taking into account the complexity of the model. By choosing a simpler model, we can avoid overfitting." - CArima Class Documentation
After perfecting a baseline model, consider exploring ensemble methods. For instance, grid search with bagging has been shown to boost trade classification accuracy to 73% for models targeting a 1:8 risk-reward ratio. Combine this with hyperparameter tuning using GridSearchCV to adjust parameters like max_depth, learning_rate, and n_estimators for better optimization. To speed up these iterations, tools like Traidies can be invaluable. They let you describe strategies in plain English, generate MQL5 code automatically, and run historical backtests seamlessly.
FAQs
How many bars of history are needed to train a reliable model in MQL5?
The number of bars you need largely depends on how complex your model is and the type of trading strategy you’re using. For example, simpler models like ARIMA require just enough data to account for orders and lags. On the other hand, more advanced systems, such as neural networks or high-frequency trading setups, typically need much larger datasets to function effectively.
A good rule of thumb is to incorporate a configurable buffer - something like 200 bars can work well. The key is finding the right balance between having enough data for accuracy and maintaining computational efficiency. Tools like Traidies can streamline this process by automating backtesting, helping you fine-tune your setup with ease.
How do I avoid look-ahead bias when building features and targets in MQL5?
To prevent look-ahead bias in MQL5, it's essential to ensure your model relies solely on data that would have been available at the time of making predictions. Use lagged features to represent historical data and adjust target variables by shifting them so that features align correctly with future outcomes. When splitting your dataset, maintain the chronological order - train your model on earlier data and reserve later periods for testing. Also, make sure your preprocessing steps are consistent for both the training phase and live trading to avoid any mismatches.
When should I train models directly in MQL5 vs import an ONNX model from Python?
Training models in Python and exporting them to the ONNX format is a smart way to utilize Python's powerful libraries for feature engineering and advanced model training. The ONNX format ensures efficient inference, especially when deploying in MetaTrader 5.
In MQL5, focus on tasks like data normalization and preparing inputs. This approach keeps your logic flexible, enabling you to update parameters locally without needing to retrain or re-export the entire ONNX model.