Candlestick Pattern Detection with MQL5 AI
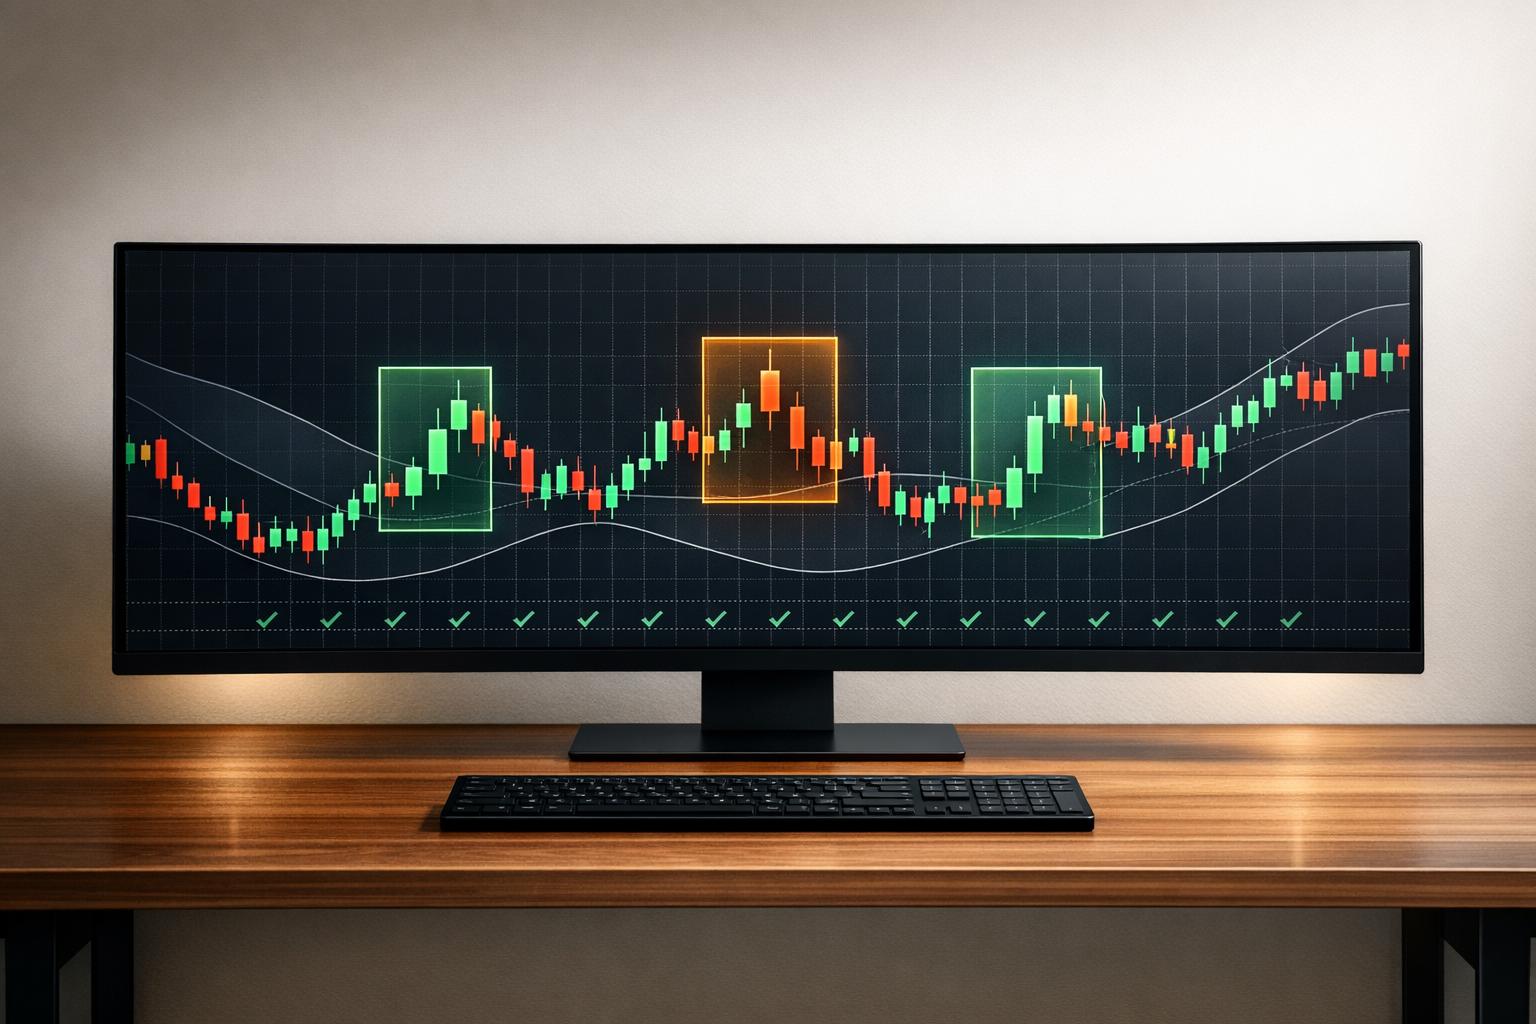
Candlestick Pattern Detection with MQL5 AI
AI-powered candlestick pattern detection in MQL5 is transforming trading strategies. By combining MQL5's automation with AI's ability to analyze market data, traders can identify patterns such as Doji, Hammer, and Bullish Engulfing with greater precision and efficiency. Here's what you need to know:
- Candlestick patterns represent price movements, helping traders predict market trends.
- AI integration improves pattern detection by learning from historical data, unlike static, rule-based methods.
- Tests show AI-enhanced logic can increase profits and reduce trade frequency, making signals more reliable.
- Tools like MetaTrader 5, Traidies, and historical OHLCV data are essential for setup and backtesting.
- Using ATR-based thresholds ensures pattern detection adapts to market volatility.
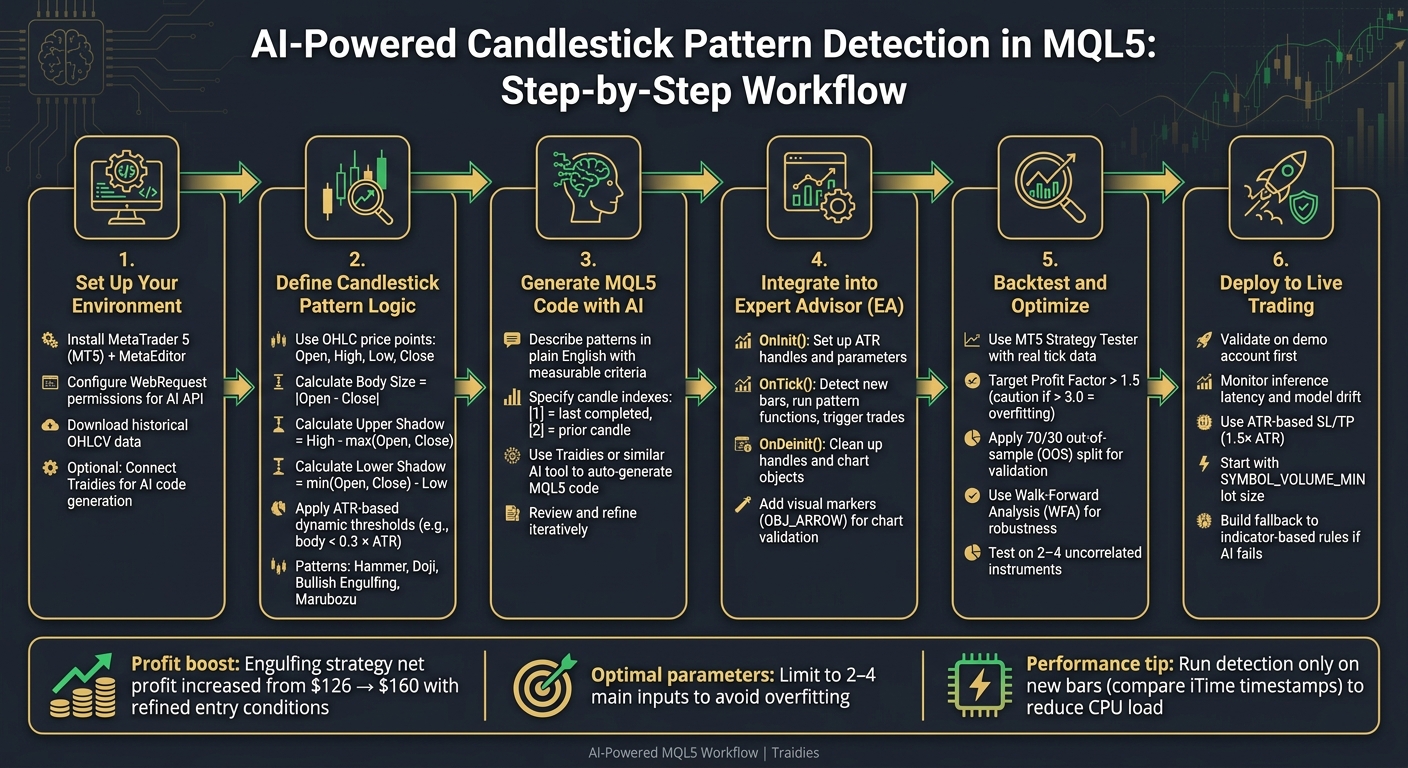
AI-Powered Candlestick Pattern Detection in MQL5: Step-by-Step Workflow
MQL5 - Detect Hammer and Shooting Star Candlestick Pattern
sbb-itb-3b27815
Setting Up Your Environment
Before diving into coding, it's crucial to prepare your tools and environment to avoid unnecessary hiccups later.
Tools and Accounts You Need
You'll need a small but essential set of tools to get started. MetaTrader 5 (MT5) is your primary platform - it’s where your Expert Advisor (EA) will operate. MT5 comes with MetaEditor, an integrated development environment for writing and compiling MQL5 code. To simplify coding, platforms like Traidies allow you to describe your trading strategy in plain English and generate MQL5 code automatically.
| Tool or Account | Purpose |
|---|---|
| MetaTrader 5 | Trade execution and backtesting |
| MetaEditor | MQL5 coding and debugging |
| Traidies | AI-assisted code generation and backtesting |
| Broker Account (demo/live) | Environment for signal execution |
| Historical OHLCV Data | Backtesting and AI model training |
You’ll also need historical OHLCV (Open, High, Low, Close, Volume) data for the financial instrument you’re targeting. This data is vital for backtesting your strategies and, if needed, for training machine learning models.
Installing and Configuring MetaTrader 5
Download MT5 from your broker’s website or directly from MetaQuotes. Once installed, open a demo account to test your strategies safely without risking real funds. You can access MetaEditor directly from MT5 via Tools > MetaQuotes Language Editor - this is where you’ll write and compile your MQL5 code.
If your EA requires communication with an external AI API, adjust MT5’s settings by navigating to Tools > Options > Expert Advisors. Enable "Allow WebRequest for listed URL" and add the API endpoint (e.g., https://api.openai.com) to the list of permitted URLs. Without this step, MT5’s security settings will block the connection. To prepare for backtesting, export target symbol OHLCV data using the Symbols dialog (Ctrl+U).
Pre-Implementation Readiness Checklist
Before you jump into coding, ensure the following prerequisites are met:
- MetaTrader 5 installed and linked to a demo or live broker account
- MetaEditor accessible from within MT5
- Required libraries in place - for example, copy
ta-lib.mqh(for candlestick detection) into yourMQL5/Includefolder - Historical OHLCV data downloaded for your chosen symbol and timeframe
- WebRequest permissions enabled for the external AI API endpoint
- AI platform access verified - if using Traidies, confirm your account is active and generating MQL5 code
"AI promises to act as a powerful co-pilot, significantly enhancing productivity and potentially the quality of MQL5 code." - Trading Strategies Academy
Quick Tip: Test your terminal’s connectivity with the AI endpoint by running a simple WebRequest() function in MetaEditor.
Once these steps are completed, you’re ready to move on to designing your candlestick pattern logic. With a well-prepared environment, you’re setting yourself up for smoother development and testing.
Designing Candlestick Pattern Logic
Key Elements That Define Candlestick Patterns
Candlestick patterns are built around four price points: Open, High, Low, and Close (OHLC). The body of the candlestick represents the range between the Open and Close, while the wicks (also called shadows) extend to the High and Low. These OHLC values are the foundation for mathematically defining any candlestick pattern.
Three primary measurements play a role in this logic:
- Body size: This is calculated as
MathAbs(Open - Close). UsingMathAbs()ensures the result is always positive, regardless of whether the candlestick is bullish or bearish. - Upper shadow: This is determined by
High - MathMax(Open, Close). - Lower shadow: This is calculated as
MathMin(Open, Close) - Low.
Instead of relying on fixed pip values, it's better to use dynamic thresholds like the Average True Range (ATR). For example, a 10-pip body on EUR/USD might not mean the same as a 10-pip body on Gold. Defining a small body as body_size < 0.3 * ATR ensures consistency across different instruments and market conditions.
Defining Common Candlestick Patterns with Specific Rules
Translating visual patterns into code requires replacing subjective judgment with clear, measurable conditions. Below are examples of how to define three common candlestick patterns:
| Pattern | Conditions |
|---|---|
| Hammer | The body is small and positioned near the top of the range. The lower shadow is at least twice the size of the body, and the upper shadow is minimal (no more than about 30% of the body size). |
| Bullish Engulfing | The first candle is bearish, followed by a bullish candle. The bullish candle's open is below the bearish candle's close, and its close is above the bearish candle's open. |
| Doji | The difference between the open and close is very small compared to the overall range - for instance, the body is 3% or less of the total high-to-low range. |
| Marubozu | There are little to no wicks on either end. For example, MathAbs(Open - Low) < 0.1 * ATR and MathAbs(Close - High) < 0.1 * ATR. |
When coding in MQL5, it's important to understand how time series indexing works. In MQL5, [0] refers to the currently forming candle, [1] is the most recently completed candle, and [2] is the candle before that. For accurate backtesting, focus on completed candles (e.g., [1] and [2]) to avoid acting on incomplete data.
Describing Patterns in Plain English for AI Tools
If you're using an AI tool like Traidies to generate MQL5 code, the way you describe patterns matters. Ambiguous terms like "a candle with a long lower wick" should be replaced with measurable criteria. For example, you might say: "The lower shadow is at least twice the size of the body, and the body is less than 10% of the total range of the candle."
Here are some tips for effective descriptions:
- Clearly indicate which candle indexes (e.g.,
[1],[2]) your conditions refer to. - Specify whether a bullish engulfing pattern should cover the entire high-to-low range or just the body of the preceding candle.
- Include context, such as noting that a Hammer is typically a bullish signal only when it appears after a downtrend.
Implementing Candlestick Detection with MQL5 and AI
Writing Candlestick Detection Code in MQL5
To implement candlestick detection in MQL5, you’ll need to translate your pattern logic into code using four key functions: iOpen(), iClose(), iHigh(), and iLow(). These functions retrieve price data for specific bars, with index [1] representing the most recently completed candle. It’s crucial to focus on completed candles to avoid basing decisions on incomplete data.
For better organization, encapsulate each pattern into a separate boolean function, such as isHammer(). This approach computes the necessary values and returns true if the pattern conditions are met. Keeping the logic modular not only simplifies testing and debugging but also makes it easier to reuse the code in multiple Expert Advisors.
When detecting patterns like Doji candles, avoid relying on strict equality due to minor price fluctuations in live markets. Instead, apply a tolerance value - like 0.1 * ATR (Average True Range) - to account for these variations.
"The challenge is defining what 'small,' 'long,' or 'large' means. A fixed value... won't work consistently across different assets or market conditions. This is where ATR shines - it provides a dynamic, volatility-adjusted threshold." - MQL5 Article 17525
To improve performance, ensure your detection logic runs only on new bars. Compare the current iTime value with a stored timestamp to verify if a new candle has been completed. This prevents the scanner from executing on every tick, which is especially important during high-frequency activity.
Generating MQL5 Code with AI Assistance
Once you’ve defined the pattern logic, AI tools can help streamline the coding process. Platforms like Traidies allow you to describe your candlestick strategy in plain English, and the system generates the corresponding MQL5 code for you.
The clarity of your description plays a huge role in the quality of the generated code. For example, a vague instruction like "detect a hammer" will lead to generic results. Instead, provide clear and detailed prompts, such as:
"Identify a Hammer on the completed candle at index: the lower shadow must be at least twice the body size, the upper shadow must be less than 10% of the body, and the body must be smaller than 0.3 times the 14-period ATR."
This level of detail ensures the AI produces precise and usable code. After generating the initial version, review it against your pattern rules. If the output isn’t accurate, refine your description and repeat the process. This iterative approach can save time compared to debugging code written manually, especially for complex multi-candle patterns like Bullish Engulfing, where indexing relationships between [1] and [2] must be exact.
Adding Pattern Detection Logic to an Expert Advisor
After creating the detection functions, integrate them into your Expert Advisor. The table below outlines how each EA event handler contributes to this process:
| EA Event Handler | Role in Pattern Detection |
|---|---|
OnInit() |
Sets up ATR indicator handles and defines pattern parameters. |
OnTick() |
Checks for new bars, updates OHLC data, runs detection functions, and triggers trades. |
OnDeinit() |
Cleans up indicator handles and chart objects created during the session. |
Within OnTick(), verify new bars by comparing timestamps, then use CopyRates to update OHLC data. Afterward, call your detection functions and, if a pattern is identified, execute trades with Trade.Buy() or Trade.Sell(). Always confirm that no open positions exist before placing new trades to avoid unintentional stacking.
To enhance reliability, consider adding visual markers - like OBJ_ARROW or OBJ_RECTANGLE via ObjectCreate - to flag detected patterns on the chart. This visual feedback helps you verify that the bot is identifying patterns correctly. Additionally, implement an alert cooldown of around 60 seconds to prevent repeated signals during volatile market conditions.
Backtesting and Optimizing Candlestick Strategies
Once your detection logic is in place, the next step is to dive into backtesting and fine-tune your parameters. This ensures your strategy can deliver reliable results under real-world conditions.
Preparing Historical Data for Backtesting
Start by ensuring your historical data is complete and accurate. While MetaTrader 5 (MT5) automatically syncs M1 bars and tick data from your broker's server during backtests, gaps in the data can lead to misleading performance metrics. To avoid this, press F2 to open the History Center and manually verify that all required data has been downloaded.
A critical but often overlooked detail is the initial data buffer. This is the historical data MT5 loads before the test start date to initialize indicators. For accurate testing, ensure MT5 has enough data - such as at least 100 daily bars for D1 charts or about 8 years for MN1 charts. If you're working with limited historical data, consider switching to lower timeframes, like H1 or M15, which require a smaller data buffer.
"Backtesting in MT5 allows you to rigorously test strategies on historical data, revealing their true edge before risking real capital." - Saeid Soleimani
Consistency is key. Use the same dataset for both AI training and backtesting to avoid skewed results.
Once your data is ready, move on to running strategy tests under conditions that mimic real trading as closely as possible.
Running Strategy Tests
The mode you select for testing directly impacts both accuracy and speed. Here’s a quick breakdown of the options:
| Testing Mode | Data Source | Accuracy | Speed |
|---|---|---|---|
| Every tick (real ticks) | Broker tick data | Highest | Slowest |
| Every tick | Synthetic ticks | High | Moderate |
| 1 Minute OHLC | 4 price points (M1) | Lower | Fastest |
For the most precise results, use the "Every tick (real ticks)" mode, which relies on actual broker tick data. "Every tick" mode is slightly less accurate but still reliable, while "1 Minute OHLC" mode is best for a quick overview rather than in-depth validation.
To avoid inflated performance metrics, configure the Strategy Tester to account for spreads, commissions, and slippage. A Profit Factor above 1.5 is a good starting benchmark for a viable strategy, but be cautious if it exceeds 3.0 - it could indicate overfitting to historical data.
Tuning Strategy Parameters to Avoid Overfitting
Once you’ve tested your strategy, the next step is to fine-tune your parameters. Overfitting is a common trap in backtesting, where a strategy is overly tailored to historical noise. To counter this, use out-of-sample (OOS) testing: optimize your rules on 70% of the data, then validate them on the remaining 30% without making further adjustments. If the strategy performs well on the untouched 30%, it’s a strong indication it has a real edge.
For even more robust validation, apply Walk-Forward Analysis (WFA). This method optimizes parameters on a rolling data window and tests them forward, simulating real-time performance.
"Walk-Forward Analysis (WFA) is the gold standard for validating adaptive strategies, offering a true picture of real-world parameter stability." - QuantStrategy.io Team
Keep your parameters simple - ideally, limit them to two to four main inputs. Also, ensure performance remains stable across a range of nearby values. For example, if your Hammer detection works at a body-to-ATR ratio of 0.30 but fails at 0.28 or 0.32, the strategy might be too finely tuned.
Finally, test your strategy on multiple uncorrelated instruments, such as an FX pair and a commodity. This helps confirm that the pattern works across different markets and isn’t just a coincidence tied to a single chart’s history.
Integrating Candlestick Patterns into Live Trading
With a backtested strategy showing promising results, the next step is to bring it into live trading while maintaining its effectiveness.
Turning Detected Patterns into Trading Signals
Candlestick patterns are only useful if they lead to actionable trading signals. One way to achieve this is by using a weighted voting system with MQL5's CExpertSignal class. For instance, you might assign an Engulfing pattern a weight of 80 and a Doji a weight of 60, and then execute trades only when the combined weight exceeds a predetermined threshold.
When integrating AI models, structured communication becomes crucial. As MQL5 developer Allan Munene Mutiiria notes:
"A response like 'the trend looks bullish' carries no structured data - it cannot be parsed, logged, or fed into an order function."
To address this, implement a KEY:VALUE protocol (e.g., SIGNAL:BUY, SL:1.0850) to ensure signals are consistently parsed and executed by your Expert Advisor (EA).
Once signals are defined, managing risk effectively becomes the next priority.
Risk and Money Management
Using ATR (Average True Range)-based stops is a smart way to adjust for changing market volatility. By setting stop-loss and take-profit levels at 1.5x ATR, you maintain a steady risk-reward ratio, whether you're trading a calm EURUSD session or a volatile XAUUSD market.
Position sizing should also reflect the confidence level of your signals. For example, if an AI model generates a high-confidence signal, a larger position size may be appropriate. Conversely, during uncertain conditions, reducing position sizes is a safer approach. A case study on an engulfing strategy for EURUSD (2023–2025) demonstrated that refining entry conditions - such as factoring in wick lengths and open-price movements - boosted net profit from $126 to $160 while reducing the total number of trades.
With risk controls in place, the next stage is transitioning from demo testing to live execution.
Moving from Demo to Live Trading
Start by validating your strategy in a demo environment. This allows you to monitor inference latency and detect model drift, which happens when a model's accuracy deteriorates as market conditions change.
"Incorporating an AI model into an MQL5 trading strategy can help overcome existing challenges by infusing machine learning-based adaptability and decision-making capabilities." - Hlomohang John Borotho, Founder and CEO at GIT Capital
When you're ready to go live, begin with the smallest allowable lot size (SYMBOL_VOLUME_MIN). This minimizes financial risk while you confirm that live performance mirrors your demo results. Only scale up once you're confident in the strategy's real-world execution. Additionally, build a contingency protocol - such as reverting to traditional indicator-based rules - in case your AI system malfunctions or produces unusual signals. Platforms like Traidies can simplify this transition by streamlining code generation and backtesting, reducing manual effort.
| Transition Step | Action | Purpose |
|---|---|---|
| Demo Validation | Use sandboxed demo trading | Test logic without risking capital |
| Latency & Drift Monitoring | Track inference speed and accuracy | Ensure AI stability over time |
| Risk Control | Use ATR-based SL/TP (1.5x ATR) | Adjust stops to match market volatility |
| Contingency Protocol | Fallback to indicator-based rules | Protect capital during AI system failures |
| Gradual Scaling | Start with SYMBOL_VOLUME_MIN |
Safely validate live execution |
Conclusion
Integrating MQL5 with AI takes candlestick detection to a whole new level, shifting it from a tedious manual task to a dependable, automated process. This guide walked you through defining pattern logic, using AI to generate MQL5 code, backtesting with historical data, and eventually moving into live trading.
Backtesting results and AI-driven models clearly demonstrate an edge in performance. These findings highlight the benefits of combining AI with candlestick detection and trading automation. By following the outlined principles, your strategy can maintain both precision and efficiency.
Key takeaways include applying ATR-based dynamic thresholds, blending candlestick patterns with technical indicators, and visually validating your logic. Analysis of feature importance reveals that patterns like the Spinning Top and Doji are particularly effective predictors.
Using tools like Traidies speeds up strategy creation by converting natural language ideas into MQL5 code and enabling automated backtesting.
FAQs
How do I stop my EA from detecting patterns on the current candle?
When using an Expert Advisor (EA), it's essential to ensure it evaluates only fully formed candles to avoid false signals. To achieve this, adjust the logic so that pattern detection is performed only after the current candle has closed. You can do this by comparing the timestamp of the current candle with the last closed candle. If the timestamps differ, it confirms the current candle has closed, allowing the EA to proceed with detection. This approach ensures the EA skips analyzing patterns during the formation of the current candle, reducing the chances of inaccurate signals.
What’s the best way to set ATR-based thresholds for different symbols?
The ATR indicator is a powerful tool for setting thresholds that adapt to market conditions. By using it, you can create dynamic, volatility-adjusted levels specific to each trading symbol. For example, thresholds like "body size less than 30% of ATR" or "upper wick at least twice the body size" automatically adjust based on market volatility. This approach ensures more consistent candlestick pattern detection and better risk management, even when dealing with assets that have varying levels of volatility.
How can I validate that AI-generated MQL5 pattern rules match my intent?
To make sure that AI-generated MQL5 rules match your trading goals, it's essential to compare the detected patterns with your specific criteria and manual observations. Here’s how you can approach this:
- Define clear pattern rules: Start by outlining precise rules for patterns like engulfing candles or Doji formations. These should reflect the exact conditions you want to detect.
- Visually inspect results: Use chart markers to see how the AI identifies patterns on actual price charts. This helps you spot any discrepancies or missed signals.
- Cross-verify with manual analysis: Compare the AI's detections with your own manual analysis to ensure alignment. This step is crucial for identifying gaps or errors.
If the results aren't meeting your expectations, tweak the parameters or thresholds in your rules. Keep refining through iterative testing to enhance both the accuracy and consistency of the pattern detection process.