Case Study: Multi-Objective Optimization in Algorithmic Trading

Case Study: Multi-Objective Optimization in Algorithmic Trading
Multi-objective optimization (MOO) is transforming algorithmic trading by addressing the challenge of balancing conflicting goals like maximizing returns and minimizing risk. Unlike traditional single-objective methods, MOO evaluates multiple objectives simultaneously, offering traders a spectrum of strategies tailored to different risk-return preferences. The result is a Pareto front, enabling informed decision-making without oversimplifying complex trade-offs.
Key takeaways from the case study:
- Market Focus: The EUR/USD forex pair, analyzed using daily bars, provided reliable data for strategy testing.
- Optimization Goals: Strategies aimed to maximize returns, minimize drawdowns, and improve expected return rates.
- Algorithms Used: NSGA-II and MOEA/D were employed to identify Pareto-optimal solutions.
- Performance Results: Multi-objective strategies consistently outperformed single-objective methods in live trading scenarios.
- Automation: AI tools like Traidies streamline the transition from optimized parameters to live trading with MQL5 automation.
Case Study Design and Data Setup
Market Selection and Data Sources
This case study zeroes in on the EUR/USD forex pair, one of the most liquid markets globally. High liquidity ensures minimal slippage, making backtesting results more dependable when transitioning to live trading.
The analysis used daily (D1) bars, which help capture long-term trends while filtering out short-term noise. The lookback period was adjusted based on market volatility. For calmer markets, a 50–100 day lookback was applied, with re-optimization occurring every 1–3 months. In contrast, volatile conditions required a shorter 10–20 day lookback, with re-optimization happening every 2–4 weeks.
| Volatility Level | Lookback Period | Re-Optimization Frequency |
|---|---|---|
| Low | 50–100 days | Every 1–3 months |
| Moderate | 20–50 days | Every 1–2 months |
| High | 10–20 days | Every 2–4 weeks |
Trading Strategies and Indicators
The study explored a combination of momentum and reversal indicators to cover a wide spectrum of market behaviors. Momentum indicators - such as SMA, MACD, and Rate of Change (ROC) - were employed to identify and ride ongoing trends. On the other hand, reversal indicators like RSI, Stochastic Oscillator, Bollinger Bands, and CCI were used to pinpoint overbought or oversold market conditions.
These indicators were selected because their parameters (like periods, thresholds, and moving averages) could be fine-tuned for better performance. For example, the default settings of the RSI (a 14-day period with 70/30 thresholds) were treated as variables during optimization.
This strategic mix laid the groundwork for the multi-objective optimization process.
Optimization Objectives
The optimization process prioritized three key goals simultaneously: maximizing total return, minimizing maximum drawdown, and maximizing the expected rate of return. This approach reflects real-world trading, where balancing profitability with risk management is critical.
Transaction costs were factored into the analysis through net benefit calculations. Additionally, Average True Range (ATR) was used to set adaptive stop-loss and take-profit levels, ensuring they adjusted to current market conditions. As highlighted by JeongHoe Lee and Navid Sabbaghi in their research on multi-objective genetic algorithms in forex trading:
"Multi-objective optimization allows us to manage the essential trade-off among profit, standard deviation, and maximum-drop."
This methodology established a solid foundation for the subsequent Pareto analysis, which plays a central role in evaluating trade-offs among competing objectives.
sbb-itb-3b27815
Optimization Methodology
Optimization Algorithms
Once the objectives were defined, the focus shifted to selecting algorithms capable of finding Pareto-optimal solutions. This case study leaned heavily on NSGA-II (Non-dominated Sorting Genetic Algorithm II). NSGA-II uses non-dominated sorting and crowding distance to handle competing objectives, making it well-suited for addressing the trade-offs outlined in the MOO framework. Additionally, MOEA/D (Multi-Objective Evolutionary Algorithm based on Decomposition) was utilized for its simplicity and interpretability, producing strategies with fewer technical indicators, which made audits more straightforward.
A study conducted in September 2024 by Yelleti Vivek and Vadlamani Ravi at IDRBT evaluated algorithms like NSGA-II and AGE-MOEA across 11 time horizons. Their findings revealed that AGE-MOEA outperformed others in 6 of the 11 horizons when optimizing for the Sharpe ratio while minimizing maximum drawdown.
"Fusing multiple objectives... risks oversimplifying the complex relationship which underlies the different objectives, and thus risks misrepresenting the performance evaluation." - Artificial Intelligence Review
With the algorithm selection complete, the next step involved encoding trading parameters for systematic optimization.
Encoding Trading Rules
To optimize systematically, each trading rule was translated into numeric parameters, with specific ranges assigned to each indicator:
| Indicator | Encoded Variable | Optimization Range |
|---|---|---|
| Moving Average | Period (n) | 9–200 days |
| RSI | Overbought/Oversold Thresholds | 70/30 or 80/20 |
| ATR | Stop-Loss/Take-Profit Multiplier | 1.0–3.0 |
| Directional Changes | Price Movement Threshold (θ) | 0.01%–5% |
Each strategy was represented as a chromosome, with numeric parameters corresponding to the indicators. This encoding allowed NSGA-II to evolve thousands of strategy combinations, testing how various configurations performed against the defined objectives.
Backtesting and Validation
After encoding, rigorous backtesting and validation were conducted to ensure the strategies were robust across historical data. To avoid overfitting, the study used walk-forward validation, training and optimizing on two years of data, followed by one year of out-of-sample testing.
Both single-pass and multi-pass simulations were compared to identify forward-looking bias, ensuring the strategy did not inadvertently use future data during optimization. Instead of simply selecting the parameter set with the highest Sharpe ratio - which often leads to poor performance in live trading - the process focused on identifying clusters of stable parameters. These clusters consistently performed well over different time periods, offering a more reliable foundation for live trading.
To ensure practicality, drawdown constraints were enforced. Strategies were only considered viable if their relative drawdown stayed below 20%. This approach helped align the optimized parameters with the goals of maximizing returns, minimizing drawdowns, and maintaining stability for real-world trading scenarios.
part5: Multi objective optimization methods
Case Study Results and Analysis
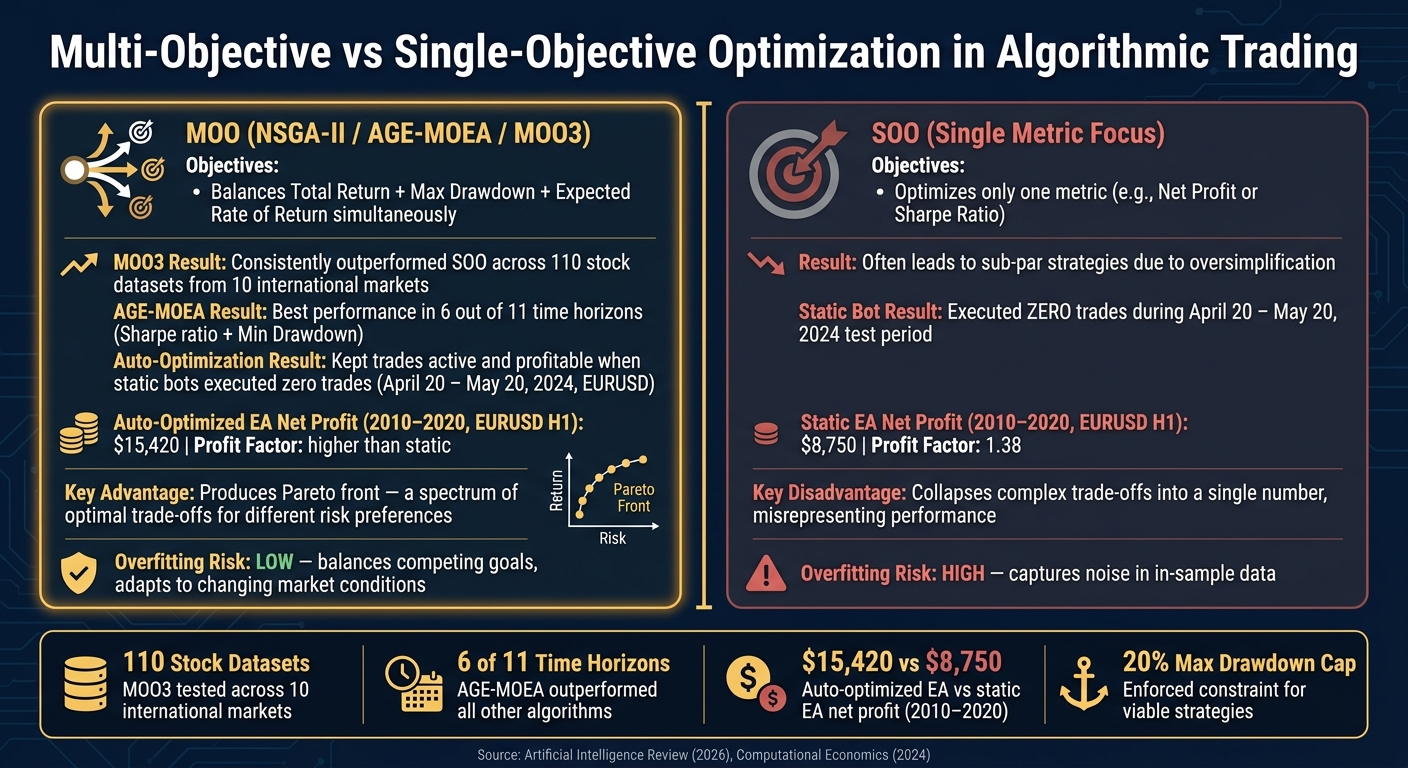
Multi-Objective vs Single-Objective Optimization in Algorithmic Trading
Performance Metrics
Using walk-forward validation, the study highlighted how multi-objective strategies excel under real-world conditions. These strategies showed greater resilience when transitioning from in-sample to out-of-sample data. A standout finding was that emphasizing risk metrics, like Maximum Drawdown, during optimization helped minimize performance drops in live testing.
In a September 2024 study published in Computational Economics, researchers Yelleti Vivek and Vadlamani Ravi tested the AGE-MOEA algorithm with a rolling-window approach (two years in-sample, one year out-of-sample). Their method, which aimed to maximize the Sharpe ratio while minimizing Maximum Drawdown, delivered consistent results across 6 out of 11 time periods. Stability was particularly strong in times without major economic disruptions.
Additionally, optimized trading bots consistently outperformed non-optimized ones in live conditions. For example, between April 20, 2024, and May 20, 2024, a Moving Average crossover strategy tested on the EURUSD pair revealed a stark contrast: the static, non-optimized version executed no trades, while the auto-optimized bot stayed active and profitable throughout the same period. Fixed parameters simply couldn’t handle the market’s shifting volatility.
Pareto Front Analysis
The Pareto front provides a visual representation of trade-offs between competing objectives. Instead of ranking strategies in a single list, it creates a curve of non-dominated solutions, where improving one objective means compromising another.
Pareto dominance ensures that no objective can be enhanced without negatively impacting another. This makes the Pareto front a powerful tool for traders, offering insight into the trade-offs involved. For instance, increasing net profit might require tolerating higher drawdowns. Unlike collapsing multiple objectives into a single metric like the Sharpe ratio, the Pareto front preserves the complexity of these relationships.
In this case, mapping the Pareto frontier for Fast and Slow moving average parameters involved 200 backtest iterations. Only a few parameter combinations ultimately made it to the frontier, highlighting the precision required. This visualization sets the stage for understanding how multi-objective optimization can impact trading strategies.
Impact of Multi-Objective Optimization
Building on the insights from Pareto analysis, researchers compared multi-objective and single-objective methods. A January 2026 study published in Artificial Intelligence Review tested the MOO3 framework, which combined Directional Changes (DC), Genetic Programming (GP), and NSGA-II, across 110 stock datasets from 10 international markets. The findings were clear:
"Results indicate that the MOO3 algorithm consistently and significantly outperforms single-objective optimisation (SOO) methods, even when the same SOO criterion is employed for choosing a single, definitive investment strategy from the Pareto front." - Artificial Intelligence Review
The table below summarizes the key differences between optimization approaches:
| Optimization Approach | Primary Objectives | Key Outcome |
|---|---|---|
| MOO3 (NSGA-II + DC) | Total Return, E[RoR], Risk | Consistently outperformed SOO across 110 datasets |
| AGE-MOEA | Sharpe Ratio, Max Drawdown | Best results in 6 out of 11 time horizons |
| SOO (Single Objective) | Single metric (e.g., Net Profit) | Often led to sub-par strategies due to oversimplification |
| Auto-Optimization | Real-time Parameter Tuning | Kept trades active when static bots failed |
Focusing on just one metric often leads to overfitting, as it captures noise in the in-sample data. By forcing algorithms to balance competing goals, multi-objective optimization creates strategies that adapt better to changing market conditions - a critical factor for success in live trading.
Practical Implementation in AI-Powered MQL5 Automation
Converting Strategies to MQL5
Once the Pareto front analysis identifies the best parameter combinations, the next step is translating those results into functional code. In practice, this involves packaging optimized parameters into initialization strings - formatted configuration files that an Expert Advisor (EA) can directly read to set itself up for live trading. This approach eliminates the need to manually rewrite code every time a new parameter set is chosen.
A common workflow combines Python for research and visualization with MQL5 for execution. Python handles tasks like testing ideas and generating Pareto charts, while MQL5 EAs implement the optimized inputs in MetaTrader 5. Universal EAs, which can read initialization strings from a database or file, allow traders to deploy multiple strategy instances without altering the core code.
This automated coding process creates opportunities for even greater efficiency when paired with AI-powered tools.
Using AI Tools for Automation
AI tools simplify the strategy conversion process. For example, Traidies drastically reduces the time needed for this step. You can describe your strategy in plain language - covering entry and exit rules, indicator settings, and risk parameters - and Traidies will automatically generate and backtest the MQL5 code. This is especially helpful after performing a Pareto front analysis, as it allows you to quickly test multiple non-dominated parameter sets without manually coding each one.
The efficiency improvements are clear. For instance, combining Python and MQL5 in a workflow can deliver impressive results. Developer Javier Santiago Gaston de Iriarte Cabrera reported achieving $15,420 in total net profit on EURUSD H1 data from 2010–2020 using an auto-optimizing Moving Average Crossover EA. This EA was configured to re-optimize every 5,000 ticks, outperforming the static version, which achieved $8,750 with a 1.38 profit factor.
"The EA auto-adapts to the current market environment, reducing always on manual supervision and parameter change." - Javier Santiago Gaston de Iriarte Cabrera, Author and Developer
Re-Optimization and Monitoring
While automation simplifies the process, continual adaptation is critical for maintaining performance. Optimized strategies need periodic updates because markets evolve - volatility fluctuates, and parameters that worked last quarter may no longer be effective today. For guidance on re-optimization frequencies, refer to the volatility table in the Case Study Design section.
A practical way to determine when re-optimization is necessary is by tracking metrics like Average True Range (ATR) or daily price ranges. When volatility spikes, shorten the lookback window and re-optimize sooner. In calmer markets, longer intervals are sufficient and maintain performance without unnecessary adjustments.
"Auto-optimization is crucial in ensuring the consistent and reliable performance of trading bots in the ever-changing financial markets." - Javier Santiago Gaston de Iriarte Cabrera, Author and Developer
This dynamic approach reinforces the importance of flexibility and resilience in trading strategies, ensuring they remain effective in shifting market conditions.
Conclusion
This case study makes one thing clear: multi-objective optimization (MOO) outperforms single-objective methods. The MOO3 algorithm excels by balancing return, expected rate of return, and risk - all at the same time - unlike single-objective approaches that focus on just one metric.
The Pareto front provides traders with a range of optimal trade-offs, tailored to different risk preferences. For instance, a trader focused on capital preservation can make a completely different choice from someone chasing maximum returns - while still relying on the same analysis, simply selecting a different point along the Pareto front.
Beyond these trade-offs, the study underscores a shift toward more accessible and flexible trading frameworks. AI-powered platforms are making sophisticated optimization tools easier to use. For example, Traidies enables traders to describe strategies in plain language, automatically generate MQL5 code, and run backtests - eliminating the need for manual coding and turning complex strategies into streamlined, automated solutions.
"The MOO3 algorithm consistently and significantly outperforms single-objective optimization (SOO) methods, even when the same SOO criterion is employed for choosing a single, definitive investment strategy from the Pareto front." - Springer Nature, Artificial Intelligence Review
Since market conditions are always evolving, dynamic re-optimization ensures strategies stay effective. By combining multi-objective optimization, event-based indicators, and self-optimizing Expert Advisors, traders gain tools that adapt to shifting conditions - keeping strategies aligned with whatever the market throws their way.
FAQs
How do I pick a point on the Pareto front?
When tackling multi-objective optimization, selecting a point on the Pareto front requires weighing trade-offs between competing objectives. The Pareto front showcases solutions where improving one goal inevitably compromises another. To make the best choice, examine the graph of potential solutions and identify the point that aligns with your specific priorities - whether that’s balancing risk tolerance with profit potential or meeting other strategic goals tied to your trading approach.
How often should I re-optimize in changing volatility?
To navigate shifting market volatility, it's important to periodically fine-tune trading strategies. How often you do this depends on the specific strategy and market conditions. Practical intervals might include daily, weekly, or during periods of significant market turbulence.
However, it's crucial to strike a balance. Frequent re-optimization can lead to high computational costs, and overfitting is a real risk. To avoid this, consider using multi-objective frameworks that weigh both profit and risk metrics. For highly dynamic markets, continuous or real-time optimization may also prove effective.
How can I turn Pareto parameters into an MQL5 EA fast?
To turn Pareto parameters into an MQL5 Expert Advisor (EA) efficiently, consider leveraging automated optimization techniques, such as genetic algorithms. Here's how you can approach it:
- Set clear objectives: Identify important metrics like profit, drawdown, and volatility to shape your Pareto front.
- Automate the optimization process: Use tools like Python or MQL5 scripts to test various parameter combinations systematically.
- Incorporate optimized parameters: Integrate the results directly into your EA code, making it ready for deployment.
This approach simplifies the process of developing EAs for algorithmic trading.