Correlation Matrix for Asset Selection in MQL5

Correlation Matrix for Asset Selection in MQL5
Correlation analysis is key to smarter asset selection in trading. It measures how different financial instruments move in relation to each other, helping you manage risk and diversify effectively. In MQL5, a correlation matrix identifies relationships between assets, guiding decisions on which to trade together or avoid.
Key takeaways:
- Correlation values range from -1.0 to +1.0: +1.0 means assets move together, -1.0 means they move oppositely, and 0 indicates no relationship.
- Diversification sweet spot: Assets with correlation values below 0.35 are ideal for reducing risk.
- Avoid redundancy: Correlations above 0.60 suggest overlapping risks.
- Use tools like Pearson, Spearman, or Kendall methods to calculate correlations.
- Automate with MQL5: Build a matrix using functions like
CopyClose()and libraries like<Math\Stat\Math.mqh>.
This guide walks you through defining an asset universe, calculating correlations, and applying them to strategies like diversification, pairs trading, and risk management - all while automating the process in MQL5. For added ease, tools like Traidies can generate and backtest your code based on plain-language strategies.
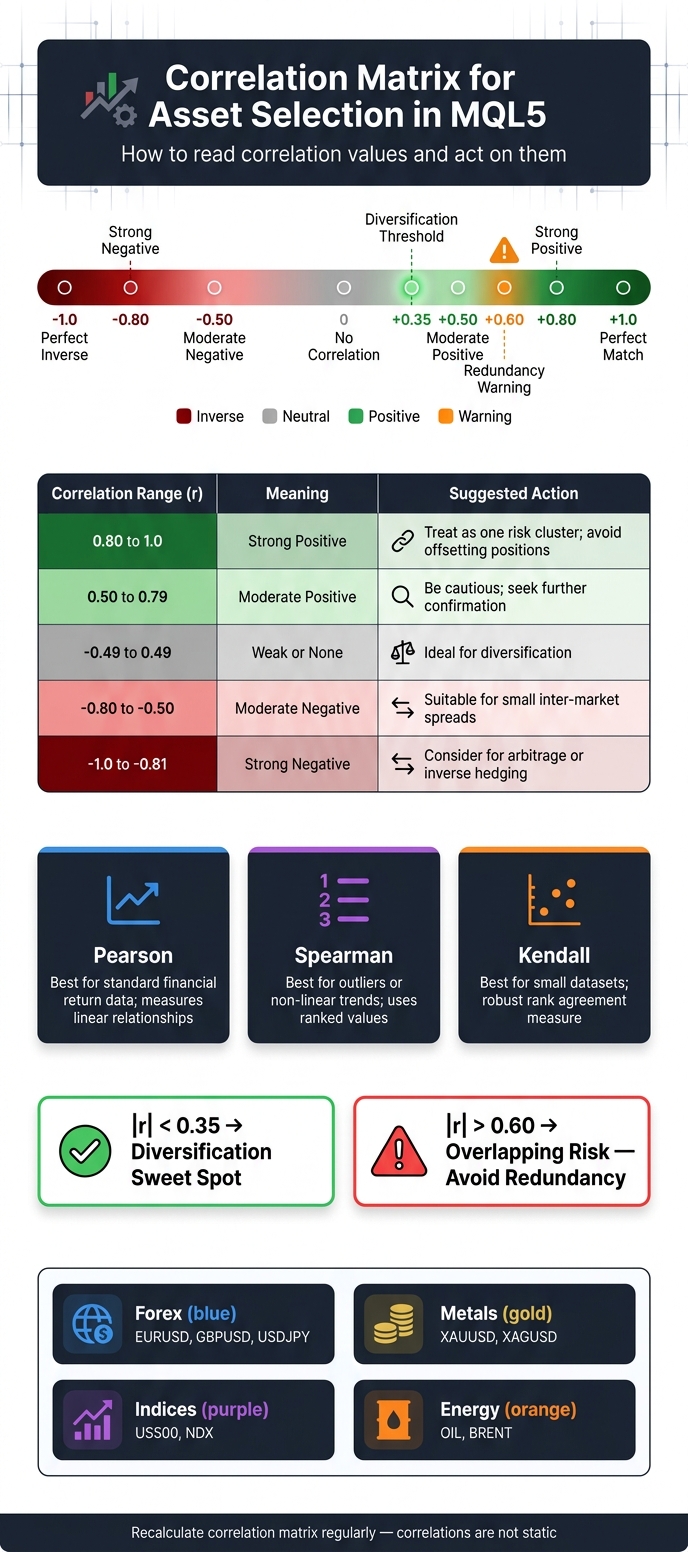
Correlation Matrix Thresholds for Asset Selection in MQL5
Building a Correlation Matrix for Asset Selection
Defining Your Asset Universe
Start by defining your asset universe, which is essentially the list of instruments you want to analyze. In MQL5, you can set this up efficiently using a comma-separated input string like this:
input string SymbolsList = "EURUSD,GBPUSD,USDJPY,XAUUSD,US500";
With this string, the StringSplit() function can break it into an array for easy iteration.
To keep things manageable, aim for a maximum of 30 symbols. This strikes a balance between meaningful analysis and maintaining smooth terminal performance. Organize your assets by category to avoid overlapping risks:
| Asset Category | Examples | Purpose |
|---|---|---|
| Forex | EURUSD, GBPUSD, USDJPY | Analyzes currency-specific risks and USD-driven exposure |
| Metals | XAUUSD, XAGUSD | Provides a hedge against currency volatility or devaluation |
| Indices | US500, NDX | Reflects broad equity market sentiment |
| Energy | OIL, BRENT | Tracks movements in commodity-linked currencies |
When initializing, always use SymbolSelect(sym, true) to ensure each symbol is active in the Market Watch. If a symbol isn’t available on your broker’s server, it's better to print a warning than let the calculation fail silently.
Once your asset universe is ready, you’ll need to set precise data parameters for accurate correlations.
Setting Data Specifications
Choose a timeframe that aligns with your trading approach. For instance, a day trader may prefer M15 data, while a swing trader might focus on D1 bars. The same asset pair can show vastly different correlation patterns depending on the timeframe used.
For the lookback period, 100 bars is a reliable starting point. It balances recent data with statistical stability. Avoid going below 50 bars, as this can lead to noisy results. Use simple returns - calculated as the percentage change between consecutive closing prices - rather than raw prices. This avoids the issue of price drift, which can artificially inflate correlation values.
To keep your analysis up-to-date, set a 5-second timer for refreshing the calculations. This frequency ensures your data remains current without overloading your terminal.
With these specifications in place, the next step is selecting the right correlation method and thresholds.
Choosing Correlation Methods and Thresholds
Once your data is structured, select a correlation method that provides the insights you need for risk management and diversification. Here are the three main options:
- Pearson: Ideal for standard financial return data. It measures linear relationships and is widely supported in MQL5.
- Spearman: Better suited for datasets with outliers or non-linear trends, as it ranks values instead of using raw numbers.
- Kendall: Best for smaller datasets where you need a robust measure of agreement between rankings.
For most cases, start with Pearson on simple returns. If extreme price movements distort the results, consider switching to Spearman.
After calculating the correlation coefficients, use thresholds to guide your decisions:
| Correlation Range (r) | Meaning | Suggested Action |
|---|---|---|
| 0.80 to 1.0 | Strong Positive | Treat assets as one risk cluster; avoid offsetting positions |
| 0.50 to 0.79 | Moderate Positive | Be cautious with offset trades and seek further confirmation |
| -0.49 to 0.49 | Weak or None | Ideal for diversification, as assets move independently |
| -0.80 to -0.50 | Moderate Negative | Suitable for small inter-market spreads |
| -1.0 to -0.81 | Strong Negative | Consider for statistical arbitrage or inverse hedging |
For effective portfolio diversification, aim for correlations with |r| < 0.35. Coefficients above |r| = 0.60 may indicate overlapping risks. To ensure the relationships are not random, pair your coefficients with p-values for statistical validation.
sbb-itb-3b27815
MQL5 Coding Tutorial - Correlation Indicator for Signals
Implementing the Correlation Matrix in MQL5
Once you've identified your asset universe and defined the necessary data parameters, you can move on to implementing the correlation matrix in MQL5. Here's how to get started.
Loading and Preparing Symbol Data
Begin by loading historical price data for each symbol using the CopyClose() function. This function requires the symbol name, timeframe, starting position (use 0 for the most recent bar), and the number of bars to retrieve.
To handle multiple symbols efficiently, define a struct called SymbolData that contains the symbol name and a price buffer (a double array). Once the data is loaded into the buffer, use ArraySetAsSeries(buffer, true) so the most recent bar is always indexed at 0. Ensure all data series are aligned by applying ArraySetAsSeries. Adjust the lookback length with MathMin() to match the shortest available series across all symbols. Convert closing prices into simple returns using the formula (Price[k] – Price[k-1]) / Price[k-1].
Always verify the return value of CopyClose() to confirm data availability. If the data does not meet your minimum requirements for any symbol pair, skip those pairs.
Writing the Correlation Calculation Function
Next, create a function - such as CalcCorrelation(double &x[], double &y[], int n) - to compute the correlation between two return series. This function should output a single correlation coefficient. For Pearson correlation, calculate the mean of both series, sum the products of their deviations, and divide by the square root of the product of their variances. Ensure the denominator is greater than zero to avoid errors.
For Spearman correlation, write a helper function to rank the raw values, then apply the Pearson formula on the ranked data. For Kendall correlation, leverage the built-in MathCorrelationKendall function from the MQL5 <Math\Stat\Math.mqh> library, which handles concordance calculations for you.
Store the correlation coefficients in a 1D array using the mapping index = (i * numSymbols + j). This method saves memory as the number of symbols increases. Set all diagonal elements (self-comparisons) to 1.0 since a symbol's correlation with itself is always perfect.
"Portfolio quality is not the sum of individual strategy quality. It is a function of how those strategies interact." - Portfolio Scorer Article
Once the coefficients are calculated, you can move on to visualizing and organizing your matrix.
Displaying and Sorting the Matrix
For visualization, use OBJ_RECTANGLE_LABEL and OBJ_LABEL objects to display each cell of the matrix. Apply a color gradient to represent correlation values visually:
| Correlation Range (r) | Visual Color |
|---|---|
| r ≥ 0.8 | Dark Green |
| 0.5 ≤ r < 0.8 | Light Green |
| -0.5 < r < 0.5 | Gray / Neutral |
| -0.8 < r ≤ -0.5 | Light Red |
| r ≤ -0.8 | Dark Red |
This gradient helps you quickly spot patterns, such as clusters of highly correlated or inversely correlated assets.
To sort the matrix by correlation strength, create an integer index array ranging from 0 to N-1. Calculate the mean absolute correlation for each symbol (excluding self-correlation), and sort the index array based on these averages. This reordering makes it easier to identify the most and least correlated assets.
For workflows that don't require visual output, print the matrix as a formatted text block in the Experts tab. This is particularly helpful during the development and debugging phases.
Applying Correlation Data to Asset Selection
Using Correlation for Diversification and Risk Management
Now that the matrix is established, you can use these correlation thresholds to make informed decisions about asset selection. Here's the key takeaway: assets with a correlation coefficient (|r|) of 0.60 or higher tend to duplicate risk exposure, while those below 0.35 act more independently, making them excellent choices for diversification. Assets with strong negative correlations (r ≤ -0.80) can serve as natural hedges, offsetting potential losses in other parts of your portfolio.
Diversification isn't just about picking different symbols; it's about spreading investments across multiple asset classes. For example, a portfolio that includes Forex, indices, commodities, and equities is typically more robust than one focusing solely on currency pairs, even when those pairs show moderate correlations.
Pairs Trading and Mean Reversion Strategies
Correlation data isn't just for managing risk; it can also unlock advanced trading strategies. Take pairs trading, for instance. This approach involves finding two assets with a historically strong relationship (r ≥ 0.80 or r ≤ -0.80) and trading based on the spread when their prices temporarily diverge. The expectation is that the assets will eventually return to their usual pattern.
However, correlations can shift dramatically over time. A great example is Nvidia (NVDA) and Intel (INTC) in 2025. Initially, the two had a negative Pearson correlation of -0.71, reflecting their competitive relationship. But after announcing a $5 billion partnership, their correlation flipped to +0.75 within three months. On September 19, 2025, a recursive CUSUM monitor flagged that the previous mean-reversion model between these stocks was no longer valid - just one day after the news broke.
Adding Correlation Rules to MQL5 Code
To make these correlation thresholds actionable, you can integrate them into your trading algorithms. A function like PassesCorrelationFilter() can help enforce these rules in real-time. For example, if a new trade signal would push correlated exposure beyond a set limit (e.g., 0.60), the function would return false, skipping the trade.
Here's a quick guide to mapping correlation values to strategy actions:
Positive Correlations:
| Correlation Value (r) | Interpretation | Strategy Action |
|---|---|---|
| r ≥ 0.80 | Strong Positive | Use for pairs trading or hedging |
| 0.60 ≤ r < 0.80 | High Positive | Avoid adding redundant exposure |
| 0.35 ≤ r < 0.60 | Moderate Positive | Verify before offset trades |
| 0 ≤ r < 0.35 | Weak Positive | Good for diversification |
Negative Correlations:
| Correlation Value (r) | Interpretation | Strategy Action |
|---|---|---|
| r ≤ -0.80 | Strong Negative | Useful for hedging or arbitrage |
| -0.80 < r ≤ -0.35 | Moderate Negative | Consider inter-market spreads |
| -0.35 < r < 0 | Weak Negative | Limited hedging potential |
To stay ahead, ensure your correlation matrix recalculates automatically - either with every new bar or on a timed schedule. This keeps your strategy aligned with current market conditions, avoiding reliance on outdated data. A dynamic approach like this ensures your asset selection remains responsive and effective.
Testing and Maintaining Correlation-Based Strategies
Backtesting Correlation Rules
When testing correlation-based strategies, it's essential to evaluate them at the portfolio level. This approach helps you understand how different strategies interact. For instance, if multiple Expert Advisors (EAs) are designed to respond to USD strength, they might end up behaving like one large USD trade rather than offering diversification.
To dig deeper, leverage MQL5's OnTester() function to export daily performance data into a CSV file. This allows you to calculate inter-strategy correlations and identify overlaps that could pose risks. One effective method is to use a weighted portfolio score. For example:
- 50% correlation score
- 25% temporal coverage
- 25% asset class diversity
This scoring system gives a more rounded view of your portfolio's resilience.
Instead of relying on a single aggregate correlation value, analyze relationships over rolling 60-day windows. This approach highlights whether correlations remain steady or start to drift over time, offering a clearer picture of their stability.
These backtesting techniques lay the groundwork for ongoing monitoring and help ensure your strategies remain effective.
Monitoring Correlation Stability Over Time
Once you've completed backtesting, the next step is to monitor correlation stability in real-time. Market conditions can change quickly, altering the relationships between assets.
To stay ahead, recalculate your correlation matrix every 60 seconds or with each new bar. Set threshold alerts for significant changes, such as when the correlation coefficient exceeds 0.80 or drops below -0.80. These alerts can help you respond promptly to shifts. For a more advanced analysis, consider using Singular Value Decomposition (SVD). This technique provides insight into market stability:
"Stable markets will only have one large entry in the S factor, and all other entries will be close to 0. The more entries in S that are far from 0, the more chaotic and volatile a market appears to be." - Gamuchirai Ndawana
By identifying these patterns, you can better understand when markets are stable versus when they're becoming unpredictable.
Risks and Limitations to Keep in Mind
While correlation analysis is a powerful tool, it comes with its own set of challenges and limitations.
"Correlation describes relationships, not causation." - Allan Munene Mutiiria
In other words, just because two assets move together doesn't mean one is influencing the other. Relying solely on correlations for trade triggers can lead to errors. Another key risk is structural breaks, where sudden macroeconomic events disrupt the relationship between assets. These shifts can render previous hedge ratios useless, requiring you to recalibrate your MQL5 correlation matrix quickly.
Here’s a breakdown of common risks and how to address them:
| Risk Factor | Description | Mitigation Strategy |
|---|---|---|
| Redundancy | Multiple EAs with similar performance patterns | Remove or reduce the weight of highly correlated EAs |
| Regime Shift | Sudden changes in asset relationships | Use tools like CUSUM or recursive monitoring for early detection |
| Model Drift | Gradual weakening of correlations over time | Recalculate correlation matrices regularly |
| Non-Linearity | Pearson correlation misses non-linear patterns | Add Spearman or Kendall rank correlation to your analysis |
| Temporal Gaps | Trades concentrated in one market session | Introduce strategies that cover additional sessions |
The best correlation-based systems treat these risks as part of their design, not as afterthoughts. By addressing these challenges proactively, you can build strategies that are better equipped to handle market fluctuations.
Conclusion
Creating a correlation matrix in MQL5 shifts your trading approach from focusing solely on individual signals to considering broader aspects like asset selection, risk management, and coding efficiency. This guide has walked you through defining an asset universe, calculating correlations using methods like Pearson, Spearman, or Kendall, and applying those insights to refine your trading strategy. By filtering redundant trades, spotting pairs trading opportunities, and managing risk more effectively, you can achieve a more deliberate approach. For instance, assets that move in tandem can amplify exposure, while those with weaker correlations (|r| < 0.5) help reduce volatility without introducing unintended directional risk. A well-constructed correlation matrix ensures this balance, even as market dynamics evolve.
Successful portfolio construction isn’t just about the strength of individual strategies - it’s about how those strategies interact. Correlation is not static; it requires regular updates, careful monitoring for changes, and management of risks like regime shifts or non-linear dependencies, as discussed in earlier sections.
For a more streamlined approach, Traidies offers a solution. It allows you to describe your correlation-based strategy in plain language and automatically generates MQL5 code, complete with backtesting using historical data. This tool provides an efficient way to test your asset selection logic before moving to live trading.
FAQs
How many bars should I use for reliable correlation?
When performing correlation analysis in MQL5, it's best to work with at least 100 to 200 bars. Using a larger number of bars and longer timeframes typically leads to more accurate results. For assets with higher volatility or specific advanced strategies, you might need to analyze even more bars. While 100 bars can serve as a baseline, aiming for 200 or more ensures more reliable and consistent outcomes.
Why calculate correlation on returns instead of prices?
Calculating correlation using returns instead of prices focuses on the relative movement and interaction between assets over time. By eliminating the influence of varying price levels, this method provides a clearer and more relevant comparison, which is particularly useful when designing trading strategies.
How often should I refresh my correlation matrix in MQL5?
The best schedule for refreshing your correlation matrix in MQL5 largely hinges on your trading strategy and the timeframe you’re analyzing. Many traders find it helpful to update the matrix daily or after significant market shifts. This ensures the data stays up-to-date, accurately reflecting how assets are interacting. Given that the matrix operates with a customizable timeframe and bar count, regular updates are key to keeping it aligned with current market dynamics.