PCA for MQL5 Strategy Optimization

PCA for MQL5 Strategy Optimization
Principal Component Analysis (PCA) simplifies trading strategies by reducing the number of correlated indicators without losing critical information. If your MQL5 strategy relies on multiple indicators, PCA can help eliminate redundancy, improve testing accuracy, and streamline decision-making. Here's how it works:
- What PCA Does: Transforms correlated indicators into fewer, uncorrelated components.
- Why It Matters: Reduces overfitting, improves generalization, and speeds up optimization.
- Steps to Use PCA: Preprocess market data, calculate covariance, decompose into components, and integrate them into your strategy.
- Key Benefits: Simplifies input variables, reduces noise, and balances training and testing performance.
For example, a strategy using 10 indicators saw testing accuracy improve from 87.5% to 89.9% after PCA reduced inputs to 8 components. Whether you're optimizing a single strategy or managing a portfolio, PCA can refine your approach while adapting to market changes over time.
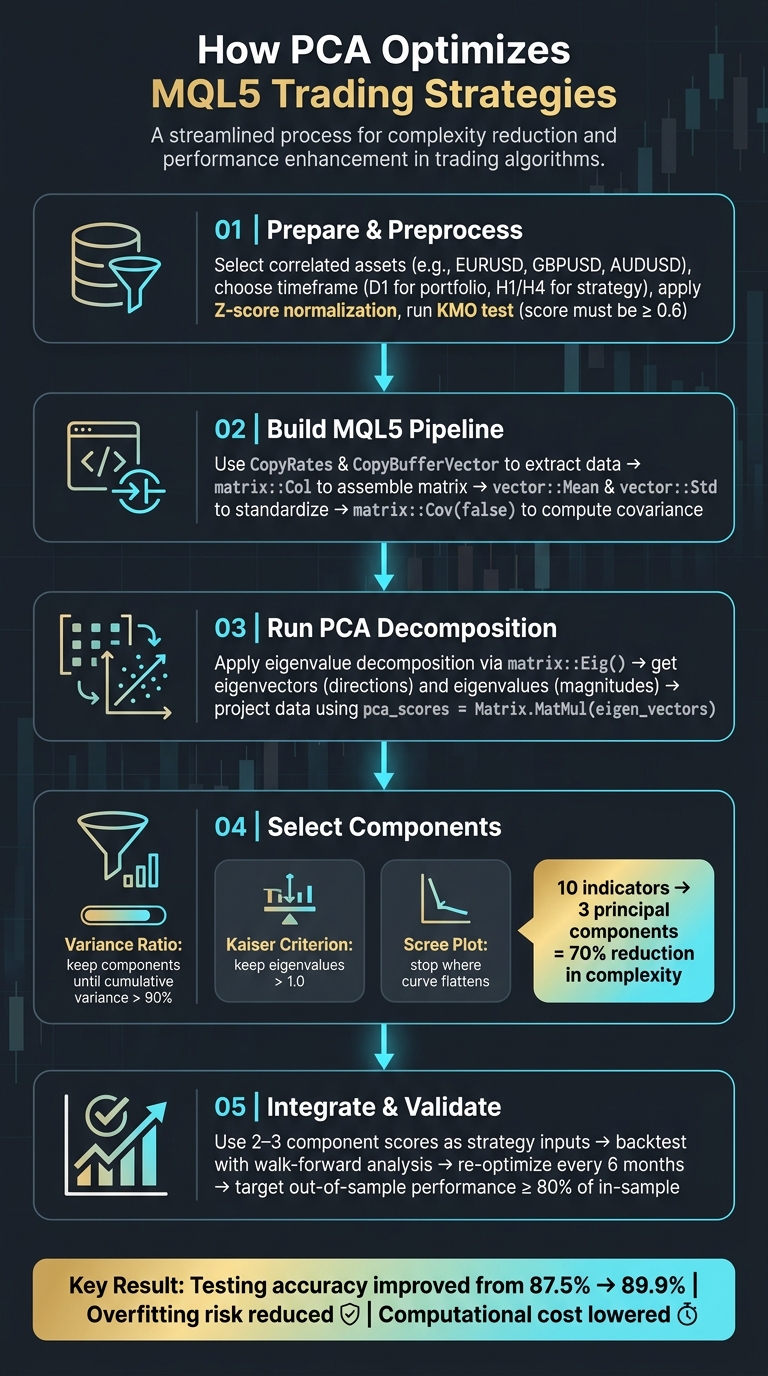
How PCA Works in MQL5 Strategy Optimization: Step-by-Step
Preparing Market Data for PCA
To get meaningful results from PCA, your market data must be clean, consistent, and scaled appropriately. Raw, unprocessed data can lead to unreliable outcomes.
Choosing Assets and Timeframes
The assets and timeframes you select will directly influence what PCA reveals. For portfolio-level analysis, daily (D1) bars are often ideal because they smooth out intraday noise. On the other hand, for strategy-level noise reduction, shorter timeframes like H1 or H4 are more practical.
When selecting assets, focus on those with strong correlations. Major FX pairs like EURUSD, GBPUSD, and AUDUSD or related equities, such as energy stocks (e.g., XOM, CVX, COP), are good examples. PCA works best when the input variables share meaningful relationships. If your data is mostly random, PCA will struggle to extract useful components.
It's also important to keep your asset order consistent. Place your most liquid benchmark asset first, such as EURUSD as Symbol 1, to ensure more reliable PCA results.
"The order of input data is crucial. PCA does not rearrange assets or determine each asset's contribution independently of its position." - Oleksandr Art'omenko
Before finalizing your dataset, evaluate its suitability with a Kaiser-Meyer-Olkin (KMO) test. A KMO score below 0.6 suggests the data may not be appropriate for dimensionality reduction. Complement this with Bartlett's Test of Sphericity - a p-value under 0.05 confirms your variables are sufficiently correlated for PCA.
Preprocessing Market Data
Market data in its raw form is non-stationary, so you'll need to preprocess it. Using price returns (e.g., 14-period changes) or normalized indicator values can help maintain stationarity.
Standardization is key. For instance, an RSI oscillates between 0 and 100, while a 200-period moving average on EURUSD might hover around 1.4500. Without scaling, the moving average could overshadow other variables purely due to its larger magnitude. Applying Z-score normalization (transforming each variable to have a mean of zero and a standard deviation of one) ensures all features are on equal footing.
"Standardizing the data before running the PCA ensures that the resulting principal components are not dominated by the variables with larger magnitude or variances, which could distort the analysis." - MQL5 Articles
For assets prone to sharp price spikes, consider using a RobustScaler instead of standard Z-score scaling. This method handles outliers more effectively. Once scaled, structure your data into a matrix format where columns represent features (like assets or indicators) and rows represent time observations. This format is essential for MQL5's matrix functions.
With your data standardized and organized, you're ready to create a robust pipeline in MQL5.
Building Data Pipelines in MQL5
MQL5 provides all the tools necessary to construct a clean and efficient data pipeline, though you can also turn trading ideas into automated bots without manual coding. Use CopyRates to pull OHLC price data and CopyBuffer (or CopyBufferVector) to retrieve indicator values directly into vectors.
Here’s a breakdown of the key pipeline steps and their corresponding MQL5 tools:
| Pipeline Step | MQL5 Tool / Function | Purpose |
|---|---|---|
| Data extraction | CopyRates, CopyBufferVector | Retrieve price or indicator data into vectors |
| Matrix assembly | matrix::Col | Insert synchronized vectors into matrix columns |
| Standardization | vector::Mean, vector::Std | Compute Z-score normalization parameters |
| Covariance | matrix::Cov(false) | Measure relationships between all features |
| Decomposition | matrix::Eig or Alglib SMatrixEVD | Extract eigenvectors and eigenvalues |
| Transformation | matrix::MatMul | Project original data into the PCA space |
One common challenge is dealing with missing or unsynchronized data. Weekend gaps, low-liquidity bars, or mismatched historical data can disrupt matrix operations. Make sure all vectors are of identical lengths before proceeding with decomposition. If the matrix::Eig() function produces inconsistent eigenvector signs across runs, switch to Alglib's SMatrixEVD method for more stable and sorted results.
sbb-itb-3b27815
Implementing PCA in MQL5
Computing Principal Components
Once your data pipeline is ready, the steps to compute PCA in MQL5 are pretty straightforward. Start by calculating the covariance matrix using Matrix.Cov(false). Next, apply eigenvalue decomposition with Matrix.Eig(). This will give you eigenvectors and eigenvalues, which represent the directions and magnitudes of variance. Finally, project your standardized data onto the principal components using the MatMul() function:
pca_scores = Matrix.MatMul(eigen_vectors)
This step transforms your original feature space into principal component scores.
Selecting the Number of Components
Deciding how many components to keep is critical, and there are three common ways to do it:
| Criterion | Description | Best Use Case |
|---|---|---|
| Variance Ratio | Retain components until the cumulative explained variance exceeds 90% | Works well as a default for most strategies |
| Kaiser Criterion | Keep components with eigenvalues greater than 1.0 | A quick way to filter out low-value components |
| Scree Plot (Elbow) | Plot eigenvalues and stop where the curve flattens | Great for visually identifying the point of diminishing returns |
For example, in an MQL5 test using 10 technical oscillators, PCA reduced the dataset to just 3 principal components while still capturing the most critical market patterns. This resulted in a 70% reduction in input complexity with minimal information loss.
"The trick in dimensionality reduction is to trade little accuracy for simplicity... Accuracy doesn't necessarily mean profits." - David J. Sheskin
To make your strategy more adaptable during optimization or walk-forward testing, you can implement an enumeration in MQL5 (e.g., CRITERION_VARIANCE, CRITERION_KAISER, CRITERION_SCREE_PLOT). This allows you to switch between selection methods without altering the core logic.
Once you’ve determined the optimal components, the next step is to integrate these scores into your trading strategy.
Integrating PCA into Trading Logic
PCA’s ability to reduce variance is a game-changer for minimizing overfitting risks and speeding up decision-making. Here are two practical ways to use PCA in your trading logic:
- Input Simplification: Instead of relying on a large set of correlated indicators, use 2–3 uncorrelated component scores as inputs for your entry logic. This streamlines your strategy and reduces the risk of overfitting by focusing on fewer, more independent signals.
- Portfolio Weighting for Market-Neutral Baskets: The first principal component's coefficients reveal each asset's contribution to the dominant variance factor. Normalize these coefficients by dividing each one by the L1 Norm (the sum of absolute values across the component). Positive coefficients suggest long positions, while negative ones indicate short positions. Typically, loadings above 0.4 or below -0.4 are considered significant, while values closer to zero contribute less to the primary drivers.
Optimizing MQL5 Strategies with PCA
Reducing Overfitting in Strategies
Overfitting is a common hurdle in algorithmic trading. When a model relies on too many correlated indicators, it often ends up learning the noise in historical data rather than identifying real market trends. This can lead to poor performance when applied to live market conditions.
Principal Component Analysis (PCA) helps tackle this issue by consolidating redundant features into a smaller set of uncorrelated components. For instance, applying PCA to a group of 10 trend-following indicators reduced the dataset to 8 principal components. This adjustment significantly narrowed the gap between training accuracy (88.9%) and test accuracy (89.9%), effectively mitigating overfitting.
Now, let’s see how PCA proves beneficial in multi-asset portfolio optimization.
Using PCA for Portfolio Optimization
PCA isn’t just valuable for single-instrument strategies; it’s also a game-changer for building multi-asset portfolios. Each principal component reveals a unique source of variance, with the first typically representing the dominant risk factor.
Take, for example, a 2024 study by Gamuchirai Zororo Ndawana. PCA was applied to a portfolio of 10 cryptocurrencies, including BTCUSD, ETHUSD, and SOLUSD, using six years of daily data. The first principal component guided the determination of optimal long/short positions and capital allocation ratios. This enabled an MQL5 Expert Advisor to dynamically adjust risk across high, medium, and low-risk trading modes.
The order of assets in the input matrix also plays a crucial role. A 2025 example involving energy sector assets like XLE, XOM, and CVX demonstrated how asset positioning impacts PCA results. For hedging strategies, prioritize assets with strong mutual correlations, such as major U.S. equity indices, and arrange them based on factors like liquidity or market cap to ensure accurate outputs.
To see the full impact, compare the performance of a PCA-enhanced strategy to a baseline model.
PCA-Enhanced vs. Baseline Strategy Comparison
Here’s how PCA improves strategy performance by reducing complexity, noise, and overfitting:
| Metric | Baseline Strategy | PCA-Enhanced Strategy |
|---|---|---|
| Inputs | High (raw indicators) | Low (principal components) |
| Noise | High | Low (filtered via variance) |
| Overfitting Risk | High | Low |
| Test Accuracy | Lower (e.g., 87.5%) | Higher (e.g., 89.9%) |
| Computational Cost | High | Low |
When evaluating strategies in MQL5, focus on performance metrics such as net profit (USD), maximum drawdown (%), and the Sharpe ratio across both in-sample and out-of-sample periods. A PCA-enhanced strategy that demonstrates consistent performance between training and testing phases - even if peak returns are slightly lower - is often more dependable for live trading.
Validating and Maintaining PCA-Based Strategies
Incorporating PCA into your trading strategy is just the first step. To achieve consistent performance in live trading, you need to validate your approach thoroughly and maintain it over time.
Backtesting and Walk-Forward Validation
Validation helps separate a genuine trading edge from a fluke. In MetaTrader 5, the "Every tick based on real ticks" mode in the Strategy Tester is ideal for this. It uses actual broker tick data, offering a realistic view of how your strategy might perform in live conditions.
To validate effectively:
- Split your historical data into two sets: an in-sample window for PCA training and optimization, and an out-of-sample window for forward testing. Ensure the PCA transformation is applied only to the training data to avoid data leakage.
- Use walk-forward analysis for ongoing validation. Re-optimize your strategy and its principal components periodically - every six months is a common interval. Aim for out-of-sample performance to be at least 80% of in-sample results.
- Simulate realistic trading conditions in the Strategy Tester by configuring spreads (e.g., 1.5 pips for EURUSD) and slippage. This prevents overly optimistic backtest results that could fail in live trading.
"Backtesting in MT5 allows you to rigorously test strategies on historical data, revealing their true edge before risking real capital." - Saeid Soleimani
These steps ensure your strategy is well-prepared for live market challenges.
Monitoring PCA Stability Over Time
Market dynamics evolve, and the relevance of principal components can fade. For example, if you previously needed three components to explain 90% of the variance but now require five, it might signal a shift in the market structure.
To stay ahead:
- Keep an eye on eigenvalues, eigenvectors, and factor loadings for significant changes. For instance, if a coefficient flips from positive to negative for a particular asset, it might indicate a shift in its relationship with the principal component, possibly altering trade directions.
- Use the Kaiser-Meyer-Olkin (KMO) test periodically. A KMO value below 0.6 suggests that the correlation structure of your dataset has broken down, signaling the need for recalibration.
- In MQL5, updating your strategy is straightforward. Save the projection matrix (loadings) as external text files and re-import them into your Expert Advisor. Functions like
matrix::Covfor recalculating covariance andmatrix::Eigfor updating eigenvectors simplify this process.
Regular monitoring and timely adjustments help keep your strategy aligned with shifting market conditions.
Trade-Offs of Using PCA in MQL5
PCA brings both benefits and challenges to trading strategies. Here’s a quick breakdown:
| Advantage | Drawback |
|---|---|
| Dimensionality Reduction: Simplifies models by combining correlated indicators | Information Loss: Some accuracy is sacrificed for simplicity |
| Noise Suppression: Focuses on shared patterns, filtering out random fluctuations | Harder Interpretation: Principal components are abstract, making them less intuitive to explain |
| Handles Multicollinearity: Manages highly correlated features effectively | Outlier Sensitivity: Extreme values can distort results |
| Faster Optimization: Fewer variables mean quicker testing in the Strategy Tester | Linear Assumptions: PCA assumes linear relationships, which may not always apply in markets |
While PCA can simplify and strengthen your strategy by reducing complexity and mitigating overfitting risks, it does come with trade-offs. One challenge is its lack of easily interpretable signals, unlike traditional indicators like RSI or moving averages, which can make justifying trading decisions to stakeholders more difficult.
Conclusion
PCA offers a practical way to fine-tune MQL5 strategies. By condensing correlated indicators into a few principal components, it helps cut through the noise and reduces the risk of overfitting, all while keeping the critical trading signals that drive your strategy intact.
Stephen Njuki sums it up well:
"Reducing dimensions can help manage the 'curse of dimensionality' where high dimensioned data tends to have accurate results when tested in sample during training, but this performance wears off more rapidly than with lower dimensioned data on cross validation."
The math behind PCA is more approachable than it might seem. With MQL5's built-in functions, you can easily retain components that explain 90%–95% of the variance, often simplifying a collection of oscillators into just a few meaningful components.
However, PCA isn’t a one-and-done solution. To keep it effective, regular upkeep - such as standardizing inputs, monitoring eigenvalues, and re-validating components - is essential as market dynamics shift.
FAQs
Should I run PCA on prices, returns, or indicator values?
PCA works best when applied to indicator values or returns, rather than raw prices. Here's why: indicator values are already processed and normalized, making them excellent at capturing essential market signals. Returns, on the other hand, are more stationary and better at reflecting the underlying market dynamics. Raw prices, however, tend to be non-stationary and heavily correlated, which often leads to unstable principal components. For optimizing strategies in MQL5, applying PCA to indicator values or returns can enhance dimensionality reduction and boost the accuracy of your models.
How many PCA components should my MQL5 strategy keep?
When determining the right number of PCA components for your MQL5 strategy, it's all about finding the sweet spot between simplicity and accuracy. Generally, you want to keep enough components to account for 90–95% of the variance in your data. That said, the exact number can vary depending on the specifics of your dataset and what you're trying to optimize.
How often should I retrain PCA as markets change?
PCA models need regular retraining to stay accurate as market conditions shift. How often this happens depends on factors such as market volatility and the demands of your trading strategy. By updating the model regularly, you ensure it remains relevant and performs well in dynamic environments.