Iterative Algorithm Development: AI Workflow Tips

Iterative Algorithm Development: AI Workflow Tips
Building a trading algorithm is no longer a slow, manual process. AI tools now let you describe strategies in plain language, generate code, and test ideas faster than ever. Platforms like Traidies simplify the entire workflow - from strategy creation to backtesting - saving up to 40% of development time. But speed alone isn’t enough. Success depends on clear goals, quality data, and regular refinement.
Key takeaways:
- Set clear trading goals: Define profit factors, drawdown limits, and risk parameters upfront.
- Use quality data: Avoid biases by including delisted stocks, adjusting for splits, and testing across market conditions.
- Leverage AI for code generation: Tools like Traidies turn plain-language strategies into MQL5 code and handle backtesting.
- Test thoroughly: Validate strategies with in-sample and out-of-sample data, and stress test under different conditions.
- Iterate and monitor: Regularly refine your algorithm to keep up with changing markets.
AI acts as a "copilot", handling repetitive tasks while you focus on strategy logic and risk management. This approach ensures faster development while maintaining reliability in live trading.
Generating Trading Strategies with AI: Practical Walkthrough
sbb-itb-3b27815
Checklist 1: Strategy Ideas and Initial Setup
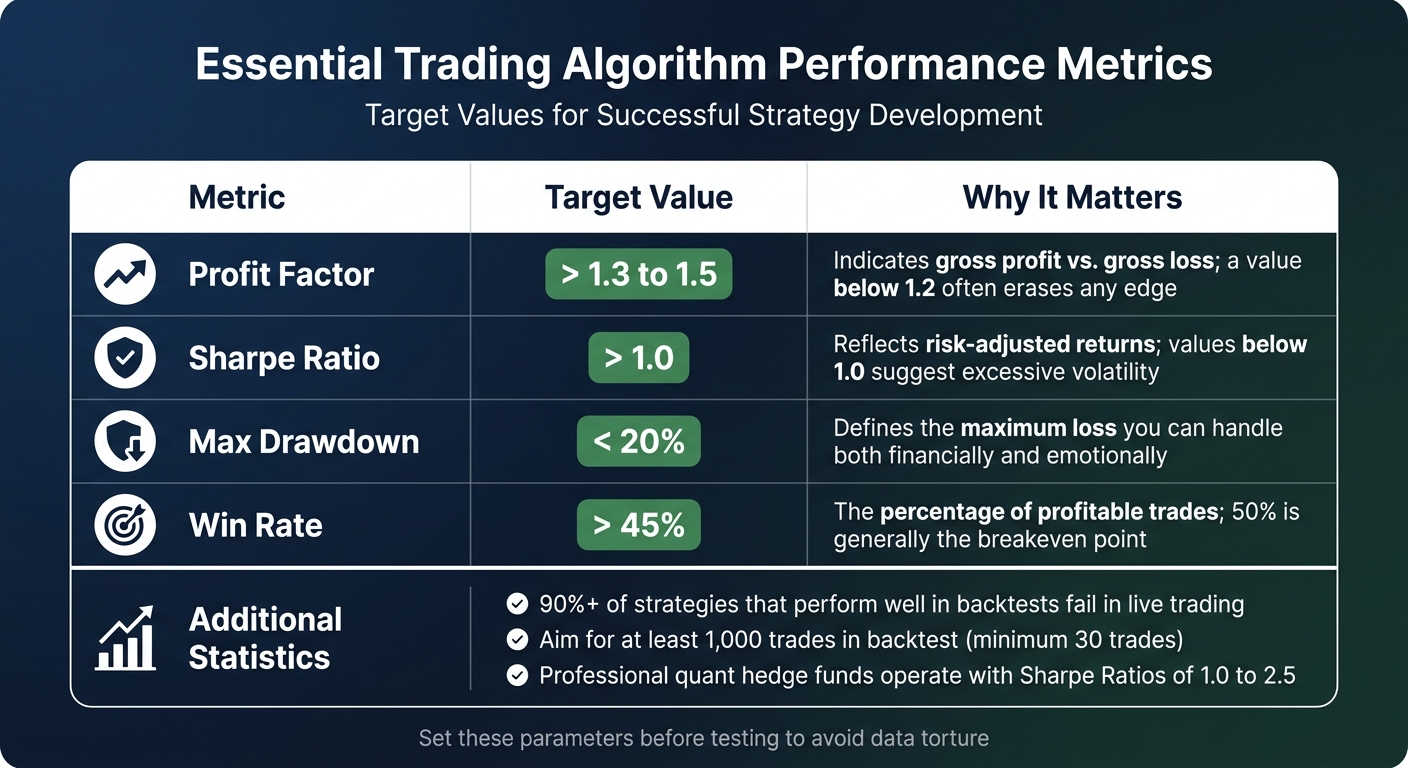
Key Trading Algorithm Performance Metrics and Target Values
Before diving into coding or generating AI-based trading strategies, it's crucial to establish a solid foundation. This involves defining clear goals and ensuring you have accurate data to test your ideas. Skipping this step is one of the main reasons why over 90% of strategies that perform well in backtests fail when applied in live trading.
Define Your Trading Goals
Start by clearly outlining what you want to achieve. Without specific, measurable goals, it's easy to fall into the trap of adjusting targets after testing, which compromises the integrity of your strategy. As economist Ronald Coase wisely noted:
If you torture the data long enough, it will confess to anything.
Prioritize risk management over profit. Set parameters like your maximum acceptable drawdown - most traders aim for less than 20% - and your risk per trade. Use benchmarks like a Profit Factor of at least 1.3 (meaning $1.30 earned for every $1.00 lost) and a Sharpe Ratio above 1.0 to maintain manageable volatility. Additionally, establish clear "stop criteria" from the outset. For example, decide in advance to halt the algorithm if the drawdown exceeds the 5th percentile of a Monte Carlo simulation.
Make sure your strategy has a logical, economic basis. Whether it's built on momentum, mean reversion, or arbitrage, you should be able to explain why it works. If you can't, the strategy might just be a black box that won't hold up in real market conditions. Also, ensure your strategy generates enough trades to produce statistically meaningful results. Ideally, aim for at least 1,000 trades in your backtest; fewer than 30 trades are often considered too random to trust.
| Metric | Target Value | Why It Matters |
|---|---|---|
| Profit Factor | > 1.3 to 1.5 | Indicates gross profit vs. gross loss; a value below 1.2 often erases any edge. |
| Sharpe Ratio | > 1.0 | Reflects risk-adjusted returns; values below 1.0 suggest excessive volatility. |
| Max Drawdown | < 20% | Defines the maximum loss you can handle both financially and emotionally. |
| Win Rate | > 45% | The percentage of profitable trades; 50% is generally the breakeven point. |
Identify Data Sources
Once your goals are defined, the next step is to secure high-quality data to validate your strategy. The granularity of your data should match your trading style: for scalping, use tick or sub-second data; for swing trading, daily or weekly bars are more appropriate. Clean data is essential - errors like missing bars, bad timestamps, duplicates, or stale prices can distort your results.
If you're trading equities, ensure the data is adjusted for splits and dividends. For example, testing Apple ($AAPL) with unadjusted data will lead to inaccurate performance metrics. Also, avoid survivorship bias by using datasets that include delisted or bankrupt companies. Testing only on current index members can artificially inflate historical results.
Use data that spans multiple market conditions. Include periods of bull, bear, and sideways markets, ideally going back to at least 2007 to capture major events like the 2008 financial crisis. Before running tests, verify the integrity of your data by checking bar counts, reviewing sessions (e.g., holidays or daylight savings adjustments), and comparing it across vendors to identify discrepancies. Reliable data is the backbone of any successful AI-driven strategy, ensuring more accurate and meaningful insights.
Checklist 2: AI-Powered MQL5 Code Generation with Traidies
Now that you've established your trading goals and gathered the necessary data, it's time to turn those ideas into executable code. Traditionally, this required hours of manual coding, but AI-powered platforms like Traidies simplify the process. These tools can transform plain English descriptions of your strategies into fully functional MQL5 code. This not only saves time but also reduces the effort spent on repetitive tasks, helping you move from concept to execution much faster.
Describe Strategies in Plain Language
With Traidies, you don’t need coding expertise to bring your strategies to life. All you have to do is describe your trading conditions, risk parameters, and timeframes in straightforward language. For example, you could input something like:
"Buy when the 50-period Moving Average crosses above the 200-period Moving Average, and the RSI is above 50. Risk 1% per trade with a stop loss at 2% below entry."
The clearer your instructions, the better the results. As Algo Special wisely points out:
"If your human logic is vague, the AI's code will be dangerous".
To avoid issues, break your strategy into key components like market conditions, entry/exit rules, stop loss and take profit logic, risk management, and time filters. Start by confirming your logic in plain English, then build the code one module at a time. This step-by-step method minimizes errors and ensures your strategy remains logically sound.
When defining risk management, be as specific as possible. For instance, specify whether your lot sizes are fixed or dynamic, such as:
"Calculate lot size as 1% of account balance, rounded to 0.01 lots."
Also, include broker-specific constraints like minimum and maximum lot sizes to ensure the generated code adheres to real-world trading conditions. Once your strategy is fully outlined, you can move on to refining the generated code.
Customize Code for Your Requirements
After generating the initial code, Traidies lets you fine-tune it to match your specific needs. You can adjust entry and exit logic, modify risk parameters such as stop loss and take profit levels (whether fixed, percentage-based, or tied to dynamic measures like Average True Range), and even add time filters to avoid trading during low-liquidity periods. Encounter a compilation error in MetaEditor? Just copy the error message back into Traidies' AI assistant for quick troubleshooting.
Traidies also supports converting older MQL4 strategies into MQL5. For example, it can replace outdated Ask/Bid variables with functions like SymbolInfoDouble(_Symbol, SYMBOL_ASK) to ensure compatibility with MetaTrader 5 and improve execution speed. However, no AI-generated code is perfect. It's crucial to have a basic understanding of MQL5 so you can review and refine the output. Before deploying your bot with real funds, test it on a demo account for one to two weeks to confirm that live performance aligns with backtest results.
Checklist 3: Backtesting and Performance Review
Testing your MQL5 code against historical data is a crucial step to understand how your strategy might perform in real market conditions before putting your money on the line. Studies indicate that more than 90% of trading strategies that seem promising during development fail when applied in live trading. Backtesting helps you figure out if your strategy has the potential to be part of the successful minority.
Set Up Backtesting Parameters
The reliability of your backtest depends heavily on the parameters you establish. Clearly define your trading rules, including entry and exit points, stop-loss and take-profit levels, and position sizing (e.g., risking 1% of capital per trade). As QuantifiedStrategies.com advises:
"If you cannot write down exact conditions for entry, exit, stop-loss, take-profit, and position sizing, refine your hypothesis before testing."
Use the same instruments and timeframes you plan to trade live. Also, match the data resolution to your strategy. For example, intraday strategies require minute or hourly data, while swing trading typically uses daily data. Swing traders should aim for 10–15 years of historical data, while intraday strategies often need 6–24 months of data.
Data quality is critical. Ensure your data accounts for corporate actions like stock splits and dividends and avoids survivorship bias by including delisted companies. Ignoring these factors can inflate your annual returns by 2% to 4%. Don’t forget to factor in realistic trading costs, such as commissions, spreads, and slippage. A good stress test is to double your commission assumptions during backtesting to see if your strategy can handle higher trading costs.
Platforms like Traidies make this process easier by integrating automated backtesting. Once you generate your MQL5 code, you can test it against historical data right away, skipping the hassle of configuring MetaTrader manually. After setting your parameters, dive into the performance metrics for a detailed evaluation.
Review Backtest Results
When reviewing your backtest, don’t just look at raw profits. Dig deeper into metrics that provide a clearer picture of your strategy’s performance. Focus on risk-adjusted returns, such as the Sharpe Ratio (aim for above 1.0, with 2.0 being excellent). However, be wary of Sharpe Ratios above 3.0, as these often signal overfitting. Most professional quantitative hedge funds operate in the 1.0 to 2.5 range.
Another key metric is maximum drawdown, which measures the largest drop in your account from its peak. Drawdowns greater than 25–30% are often unsustainable for retail traders, both emotionally and financially. The Profit Factor, calculated as gross profits divided by gross losses, should ideally exceed 1.5, with anything above 2.0 considered strong. Ensure your backtest includes at least 100 trades to achieve statistical significance.
Break down your strategy’s performance under different market conditions, such as bull, bear, and sideways markets, as well as during periods of high and low volatility. This analysis can help you spot weaknesses. A strategy that performs well overall might fail in specific scenarios. Marcus Ellington, Senior Market Analyst, emphasizes:
"A backtest that ignores drawdown duration is often more dangerous than one that ignores Sharpe. Traders quit on strategies they cannot emotionally or financially tolerate."
Finally, perform sensitivity analysis by tweaking your parameters slightly. A strong strategy will show consistent performance across a range of settings, forming a "plateau" rather than a sharp "needle-point" peak . If your strategy only works with an exact moving average length, it’s likely overfitted to historical data and may not hold up in live trading.
Checklist 4: Feedback Loops and Algorithm Refinement
Refining your algorithm after reviewing backtest results is critical - especially since only 1 in 20 strategies typically makes it to live trading. The secret lies in structured feedback loops that pinpoint weaknesses and guide precise improvements.
Apply Backtest Feedback
Start by comparing your in-sample (IS) and out-of-sample (OOS) performance. Use 70–80% of your data for optimization and keep 20–30% for validation. A noticeable drop in OOS performance compared to IS suggests your algorithm may be overfitted to historical noise. To assess robustness, calculate the Walk-Forward Efficiency Ratio (WFR) by dividing OOS return by IS return. A WFR above 0.5 indicates a sound strategy, while anything below 0.3 is a red flag for overfitting.
Walk-forward analysis is another valuable tool. By shifting the training and testing windows forward over time, you can simulate live trading and evaluate your strategy's stability across different time periods. Stable results in this analysis are a good sign. For deeper insights, run Monte Carlo simulations. These simulations resample historical trades to create alternative equity curves. If the 5th percentile of final equity falls below your starting capital, the strategy may carry excessive risk.
As Omar Ora, a quantitative finance expert, emphasizes:
"Treat the backtest as hypothesis testing: aim to falsify and then validate out-of-sample/walk-forward rather than iterating until the in-sample results look good."
Stress test your algorithm under different market conditions - bull, bear, and sideways trends. If performance is inconsistent, consider adding filters like volatility or trend indicators. Also, review practical factors like slippage, commissions, and spreads. If doubling these costs makes the strategy unprofitable, your margins are likely too thin. Focus on reducing maximum drawdown, as recovering from a 60% drawdown requires a 150% gain.
Once you've addressed these areas, the next step is keeping your algorithm aligned with evolving market conditions.
Keep Algorithms Updated
Even after refining your algorithm, regular updates are essential to adapt to changing markets.
Markets are dynamic, and strategies that worked in the past may lose their edge. In fact, research shows that returns from strategies published in academic journals decline by 26% out-of-sample and 58% after publication. Continuously update your backtests with the latest data to ensure your strategy remains effective. Establish clear "stop criteria" before going live - for instance, shutting down the algorithm if drawdowns exceed the 5th percentile of your Monte Carlo simulation or if the win rate drops 15% below historical levels.
Simplify your strategy during refinement. If profitability depends on more than five simultaneous conditions, it's likely overfitted. Aim for two or three strong parameters instead. Tools like Traidies can simplify this process by quickly generating MQL5 code from your updated strategy and retesting it with historical data. This streamlined feedback loop allows for faster validation without the need for manual coding and configuration each time.
Checklist 5: Deployment and Ongoing Management
Once you've thoroughly backtested and fine-tuned your strategy, it's time to take the leap from theory to reality. Deployment and consistent management are what bring your trading algorithm to life.
Use CI/CD Pipelines for Fast Deployment
To ensure your algorithm runs smoothly, deploy it on a reliable VPS or cloud service like AWS, DigitalOcean, or Google Cloud. These platforms often boast impressive uptime targets (e.g., 99.999%), keeping your bot operational around the clock and safeguarding it from interruptions like power outages or internet failures. Packaging your algorithm with tools like Docker can help maintain consistent functionality across both development and production environments.
When moving to live trading, use a staged deployment approach. Start with 30 days (or 50 trades) of paper trading, then transition to live trading with the smallest possible lot sizes. As Kevin Davey, a World Cup Trading Championship Winner, wisely points out:
Only 1 out of every 20 strategy ideas survives a complete professional validation process to reach live trading.
Incorporate continuous integration (CI) to automatically run backtests whenever you update code or parameters. This ensures any errors are caught early, before they affect live trading.
Risk management should be baked into your deployment. Set limits like a maximum per-trade risk (commonly 10% of your portfolio), daily loss caps (often 2%), and total exposure thresholds. Tools like PM2 or systemd can help automatically restart your bot in case of crashes, ensuring uninterrupted operation. Erik Salu highlights the importance of reliability:
A basic, reliable bot that I watch closely is always better than a fancy bot that stops for unknown reasons.
Once your bot is live, real-time monitoring becomes essential for adapting to market conditions.
Monitor and Scale Your Algorithms
Keep a close eye on both your strategy's performance (e.g., entries, exits, profit and loss, slippage) and the health of your infrastructure (e.g., API latency, data updates, rejected orders). Set up redundant alerts through platforms like Telegram, Slack, or SMS for critical events, such as hitting a maximum daily drawdown, repeated API failures, or unusual position drifts.
Log every order, signal, and risk check into a database for weekly performance evaluations. If your paper trading results stray more than 20% from backtest expectations, it could signal issues like execution delays or slippage. Keep in mind that frequent trading can rack up significant costs - strategies trading 200 times a year could lose up to 40% of their capital to fees if these aren't properly accounted for.
When scaling, take it one step at a time. Start with paper trading, then move to micro-lots, followed by 25%, 50%, and finally 100% of your target capital - only after confirming stable performance at each stage. Tools like Traidies can simplify this process by allowing you to quickly regenerate and redeploy MQL5 code as you tweak parameters, reducing manual work and speeding up iterations.
Lastly, don't overlook security. Regularly rotate and securely store your API keys to minimize potential risks.
How Traidies Supports Your Iterative Workflow
Traidies takes your iterative workflow to the next level by removing the need for manual coding. Instead of writing code yourself, you can simply describe your strategies in plain language, and the AI will translate your ideas into executable MQL5 code within seconds. This means you can go from brainstorming to testing almost instantly, as Traidies handles the essential coding tasks for you.
The platform's automated backtesting tools allow you to test your strategies against historical data, providing detailed trade logs and identifying setups that meet your criteria. This fast "Define-Backtest-Adjust" cycle helps you quickly identify and discard weaker ideas while refining your strategies based on real performance data. Whether you're tweaking stop-loss levels or adjusting entry conditions, Traidies makes it easy to regenerate and redeploy updated code. This streamlined process keeps your development moving smoothly, letting you focus on refining and testing your strategies at every step.
Conclusion
Creating trading algorithms with AI is all about speed, constant testing, and ongoing refinement. The process involves setting clear trading goals, turning plain language into executable code, running realistic backtests, making adjustments based on feedback, and carefully deploying your strategy. Each cycle of improvement helps you fine-tune your approach and stay responsive to changing market dynamics.
AI takes care of repetitive tasks, freeing you up to focus on bigger-picture decisions. Acting as a "copilot", AI can cut development time by 30% to 40% through automated code generation. That said, your expertise is still critical. You’ll need to account for broker-specific requirements, ensure your system maintains state across terminal restarts, and confirm that your backtest assumptions hold up in live trading. These steps are essential for building a reliable and adaptable trading strategy.
To succeed over the long haul, make iteration a regular habit. Markets are constantly shifting, and any trading advantage you have will eventually fade. To stay ahead, re-optimize your algorithms weekly or quarterly. And before going live, paper trade for at least 30 days or 50 trades to verify that your backtest results align with real-world performance.
FAQs
How do I know if my backtest is overfitted?
To detect overfitting in your backtest, look for strategies that perform exceptionally well on historical data but falter when applied to new, unseen data. Methods like walk-forward analysis or time series cross-validation are useful for assessing how the strategy holds up outside the original dataset. Additionally, tools like stress testing, out-of-sample analysis, and evaluating performance across varying market conditions can provide further insights. If a strategy shows unrealistically high metrics but fails these checks, it’s often a sign of overfitting.
What data issues can make my backtest results misleading?
Backtest results can sometimes paint an inaccurate picture because of factors like overfitting, survivorship bias, unrealistic assumptions about transaction costs, or inadequate data cleaning and standardization. These pitfalls can make strategies appear more successful than they actually are. To achieve dependable results, using high-quality, carefully prepared data is crucial.
What should I monitor in live trading to catch problems early?
To stay ahead of potential issues in live trading, keep a close eye on these critical areas:
- Order execution quality: Ensure trades are filled accurately and on time.
- Slippage and latency: Watch for delays that could impact your profitability.
- Risk controls: Verify that stop-losses and position sizes are functioning as intended.
- Performance metrics: Regularly review profit/loss, drawdowns, and win/loss ratios to gauge trading effectiveness.
- Operational alerts: Stay alert for system errors or connection issues that might disrupt trading.
By monitoring these factors, you can quickly catch and address problems, reducing losses and maintaining smoother operations.