Lagged Features for AI Trading Models

Lagged Features for AI Trading Models
Lagged features are past values of a time series, like yesterday's stock price, used in AI models to predict future trends. These features help identify patterns such as momentum and seasonality, making them highly effective for short-term market predictions. They are simple to compute, work well with tree-based models like XGBoost, and avoid look-ahead bias when properly applied. However, they may struggle with noise and compounding errors over longer forecasting horizons.
Key insights:
- Predictive Boost: Adding lagged features can significantly reduce model errors (e.g., RMSE improvements of 10–30%).
- Efficiency: Easy to implement using tools like Pandas'
shift()function, with minimal computational overhead. - Limitations: Best for short-term forecasts (1–48 periods). Longer-term usage may result in errors compounding.
1. Lagged Features
Predictive Accuracy
Lagged features are a game-changer for time-series data, transforming it into a format that supervised learning models can actually process. By incorporating recent past values, lagged features enable models to capture temporal dependencies directly. This is crucial because traditional machine learning models often treat data points as independent, ignoring the interconnected patterns and trends that are integral to financial markets.
The difference in accuracy can be striking. For example, in January 2025, data scientist Haden Pelletier demonstrated this with an hourly energy consumption dataset. Using a Random Forest Regressor and the NIXTLA mlforecast library, his baseline model - relying on basic features like hour, day of the week, and month - yielded a cross-validation RMSE of 1,264.1. When he added 24-hour lagged features, the RMSE dropped to 1,038.7. That’s a significant improvement in predictive performance.
"Better features beat better models."
This insight from Pietro Di Lernia, Author & Analyst at Technical Analysis Pro, highlights the power of feature engineering. Adding just three high-quality lagged features can boost model accuracy by around 10%, while upgrading from a Random Forest to XGBoost might only improve accuracy by 1–3%.
That said, lagged features shine in short-term predictions (1–48 periods). Beyond this range, the model starts relying on its own predictions as inputs, which can lead to compounding errors over time. To mitigate this, consider transforming the data by calculating returns first and then applying lags to those returns rather than to raw prices. Using multiple lag intervals - such as 1, 3, 5, and 10 periods - can provide a well-rounded perspective, balancing immediate signals with broader trends. These strategies not only improve accuracy but also set the stage for how lagged features enhance real-time trading decisions.
Signal Timeliness
Lagged features are equally valuable for generating timely signals. Shorter lags (like lag-1) capture immediate momentum, while deeper lags (such as 24-hour or 7-day intervals) reveal recurring patterns and seasonality. However, there’s a trade-off: shorter lags provide quicker signals but may overlook broader trends, while longer lags excel at identifying cycles but introduce delays.
This methodology also helps avoid look-ahead bias. To ensure models only use historical data during training, apply the .shift() command before rolling functions. One caveat: adding lags creates NaN (null) rows at the start of the dataset. For instance, a dataset with 100 rows and 30 lags loses 30% of its training data. Dropping these rows is usually necessary to maintain data quality.
Computational Efficiency
Lagged features don’t just enhance accuracy and signal reliability - they’re also highly efficient. Calculating lags requires straightforward memory shift operations, such as using Pandas’ shift() function, rather than computationally intensive aggregations.
This makes lagged features ideal for lightweight models like XGBoost or Random Forest, which can handle temporal data without the heavy computational demands of recurrent neural networks. In production settings, lagged features scale efficiently across large datasets, even for thousands of securities, thanks to their low computational overhead.
"They [lag and rolling features] provide clear explanations that require minimal computing resources and work seamlessly with various machine learning models."
Riya Bansal, a Gen AI Intern at Analytics Vidhya, reinforces this point. For high-frequency trading, focus on specific lag intervals - like 7, 14, or 28 days for weekly patterns - instead of using every possible time step. This approach maintains model simplicity and ensures faster execution.
sbb-itb-3b27815
Lag Features | Feature Engineering for Time Series Forecasting
2. Rolling Statistics
Unlike lagged features that focus on specific past values, rolling statistics provide a way to summarize historical data, offering insights into broader market conditions.
Predictive Accuracy
By aggregating recent price data into metrics like averages, standard deviations, and extremes, rolling statistics can uncover trends that static data might miss. Instead of relying on isolated price points, these features summarize data over a set time period, connecting raw numbers to the market's current state.
The results can be impressive. Between January 2023 and January 2025, researchers at Amrita Vishwa Vidyapeetham tested a hybrid AI trading system on 100 S&P 500 stocks. This system combined technical indicators with XGBoost and applied a 20-day rolling return window to filter market regimes. Starting with $100,000, the strategy grew to $235,492.83, outperforming major benchmarks. Similarly, a LightGBM model using EURUSD data, enhanced with lagged features and rolling statistics, achieved an 84% accuracy rate in predicting close prices.
"Rolling statistics turn a point-in-time price into a summary of the recent window... They are the natural bridge between pointwise data and features that describe the local regime." – Technical Analysis Pro
Rolling standard deviation is particularly useful for estimating volatility, helping models differentiate between stable and volatile market conditions. For data prone to outliers or noise, rolling medians offer a more reliable average compared to traditional means.
To avoid data leakage, always apply a .shift() before calculating rolling statistics. Features like z-scores - calculated as (Price - Rolling Mean) / Rolling Standard Deviation - are especially helpful, as they provide a stationary measure unaffected by absolute price levels.
Signal Timeliness
The window size you choose for rolling statistics plays a big role in how timely your signals are. Short windows (3–5 periods) respond quickly to market changes but are more sensitive to noise. Longer windows (14–30+ periods) smooth out noise, highlighting underlying trends, though they can introduce lag.
A useful approach is calculating a "volatility ratio" by dividing a short-term rolling standard deviation (e.g., 20 days) by a long-term one (e.g., 60 days). If this ratio exceeds 1.5, it may indicate a high-stress market regime or a potential shift, offering a balance between fast signals and stability.
Computational Efficiency
Rolling statistics are easy to implement using Pandas' .rolling() function. However, handling high-frequency data can be demanding, as calculating and storing multiple variables in real time increases computational load.
In live trading systems, a rolling price buffer (e.g., the last 20–50 prices) is often maintained to update features dynamically as new data streams in via WebSockets. While tree-based models like XGBoost and Random Forest handle scaling naturally, neural networks benefit from preprocessing with a RobustScaler. This scaler, which uses medians and quartiles, minimizes the impact of outliers while preserving the integrity of the data.
3. Technical Indicators
Technical indicators transform raw price data into variables that reflect aspects like momentum, volatility, and trend strength. While lagged features and rolling statistics provide historical context and summaries, technical indicators add signals that can make AI trading models more precise. Indicators such as RSI, MACD, and Bollinger Bands encode patterns of market behavior that AI systems can interpret more effectively than raw historical data.
Predictive Accuracy
When combined with machine learning, technical indicators significantly improve predictive performance. For example, a study covering January 2023 to January 2025 showed that integrating technical indicators with an XGBoost model led to a return of 135.49%.
In another case, an XGBoost classifier trained on 10 technical and volatility features achieved 63% out-of-sample accuracy for directional predictions. The takeaway? Technical indicators provide stationary features with consistent statistical properties, unlike raw prices, which can vary dramatically with market conditions.
These metrics highlight the value of technical indicators in generating actionable signals, especially in volatile markets.
Signal Timeliness
Different types of technical indicators work best under specific market conditions. For instance:
- Trend-following indicators like EMA and MACD excel in trending markets but may lag during reversals.
- Mean-reversion indicators like RSI and Bollinger Bands are better at identifying overbought or oversold conditions in sideways markets.
The challenge lies in timeliness - each indicator type performs optimally in certain scenarios, making it crucial to match the indicator to the market environment. To avoid introducing lookahead bias in live trading systems, always apply a shift operation (e.g., .shift()) when calculating indicators. This ensures the model uses only the data available at the time of the trade. Additionally, normalizing indicators using measures like ATR allows AI models to compare signals across varying market conditions.
Computational Efficiency
Technical indicators strike a balance between predictive benefits and computational demands. While they require more complex calculations than simple lagged features - such as rolling window aggregations and multi-step formulas - tree-based models like XGBoost and LightGBM handle these efficiently. These models can also update incrementally as new data becomes available.
For instance, a hybrid system tested by Pillai and colleagues processed 100 stocks with multiple technical indicators on a t2.medium AWS EC2 instance, maintaining practical execution speeds. To optimize your model, start with 30–50 features that are economically meaningful, then use feature importance rankings to narrow this down to the top 10–20 features for the final implementation.
Advantages and Disadvantages of Each Feature Type
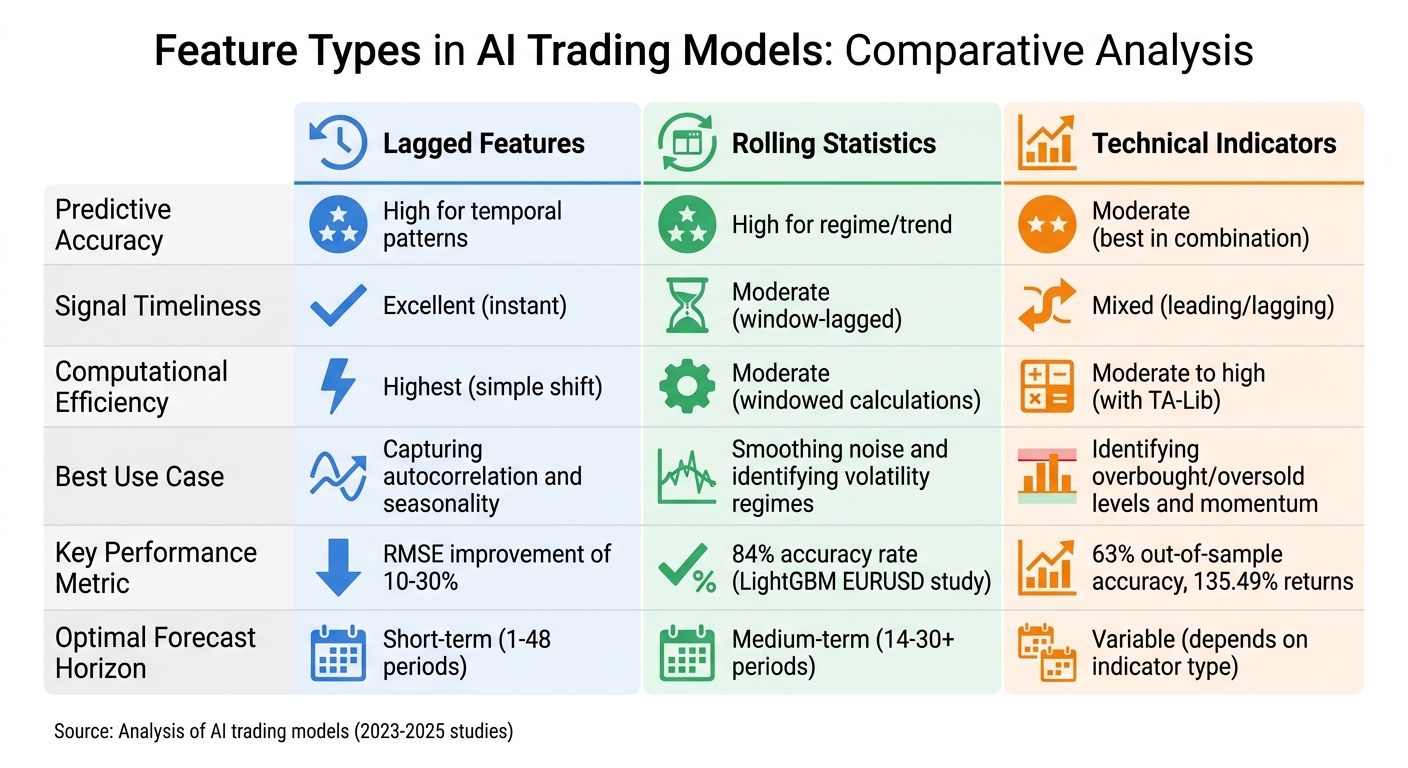
Comparison of AI Trading Model Feature Types: Lagged Features vs Rolling Statistics vs Technical Indicators
Here’s a closer look at the strengths and limitations of different feature types in AI trading models, summarized in the table below:
| Feature Type | Predictive Accuracy | Signal Timeliness | Computational Efficiency | Best Use Case |
|---|---|---|---|---|
| Lagged Features | High for temporal patterns | Excellent (instant) | Highest (simple shift) | Capturing autocorrelation and seasonality |
| Rolling Statistics | High for regime/trend | Moderate (window-lagged) | Moderate (windowed calculations) | Smoothing noise and identifying volatility regimes |
| Technical Indicators | Moderate (best in combination) | Mixed (leading/lagging) | Moderate to high (with TA-Lib) | Identifying overbought/oversold levels and momentum |
This breakdown can help guide your feature selection process, depending on the specific needs of your trading strategy.
Lagged features are the simplest to implement and excel in detecting serial correlations and seasonality. They’re lightning-fast due to their straightforward computational structure, but they don’t handle market noise well. This sensitivity can make them less reliable during sudden price spikes.
Rolling statistics, on the other hand, are excellent for identifying trends and shifts in volatility. They smooth out noise by averaging data over a defined window, but this smoothing introduces a delay. Larger windows provide cleaner signals but sacrifice responsiveness to real-time changes.
Technical indicators, such as RSI or MACD, are most effective when used together rather than in isolation. For instance, combining RSI divergence with a volume spike can yield stronger predictive power. However, these indicators often involve more complex calculations. Tools like TA-Lib can significantly speed up computations, making them more practical for real-time applications.
Selecting the right features - whether lagged, rolling, or technical - plays a crucial role in balancing predictive accuracy, signal timeliness, and computational efficiency in AI-driven trading models. Each type brings unique advantages to the table, depending on your operational goals.
Conclusion
Lagged features offer a straightforward and efficient way to identify temporal patterns in AI trading models. They shine in scenarios where past values play a direct role in shaping future movements, such as markets with strong autocorrelation or seasonal cycles. Models that include lagged features often outperform those relying solely on standard time-series data.
One key advantage of lagged features is that they retain raw historical values without applying smoothing, making them especially useful for short-term forecasting. This characteristic also makes them a great match for tree-based models.
When combined with other feature types, lagged features can significantly boost overall model performance. While lagged features excel at capturing inertia and direct temporal relationships, rolling statistics help smooth out noise and highlight trends. Meanwhile, technical indicators add value by providing scale-invariant signals that are useful for detecting momentum.
For traders aiming to build AI-driven strategies that effectively incorporate lagged features, tools like Traidies simplify the process. Traidies allows users to turn trading strategies into automated bots, leveraging AI-powered tools to handle feature engineering, including the proper setup of lagged variables while avoiding lookahead bias. The platform also offers automated backtesting with historical data, ensuring your lagged features deliver the predictive power needed for your market conditions.
Lagged features are an excellent starting point for capturing short-term patterns and seasonality in markets with strong autocorrelation. Their ease of use, speed, and interpretability make them a critical element of any AI trading model. Platforms like Traidies can help you implement these strategies efficiently and effectively.
FAQs
How many lags should I use?
The number of lags you should use largely depends on your market data and trading strategy. To determine the most effective lag length, you’ll need to experiment with different options - such as 1, 5, or 10 periods - and evaluate their predictive performance. This approach follows standard practices in time series analysis and feature engineering. Testing and refining through experimentation is essential to finding the best setup for your particular needs.
How do I avoid look-ahead bias with lags and rolling windows?
To avoid look-ahead bias, it's crucial to ensure that lagged features rely solely on past data available at the time of prediction. This can be achieved by shifting the data backward using tools like pandas' shift() function. For rolling windows, make sure calculations only include historical data up to the current point in time. Also, when splitting your data, adopt methods like time series cross-validation to preserve the temporal sequence during both training and testing.
Should I lag returns instead of raw prices?
Lagging returns, rather than relying solely on raw prices, can make AI trading models more effective. By incorporating lagged variables, models can tap into temporal dependencies, momentum, and autocorrelation within the data. This approach allows the models to better interpret historical patterns and trends, ultimately improving their predictive capabilities.