Low-Volume Markets: Backtesting Challenges
Low-Volume Markets: Backtesting Challenges
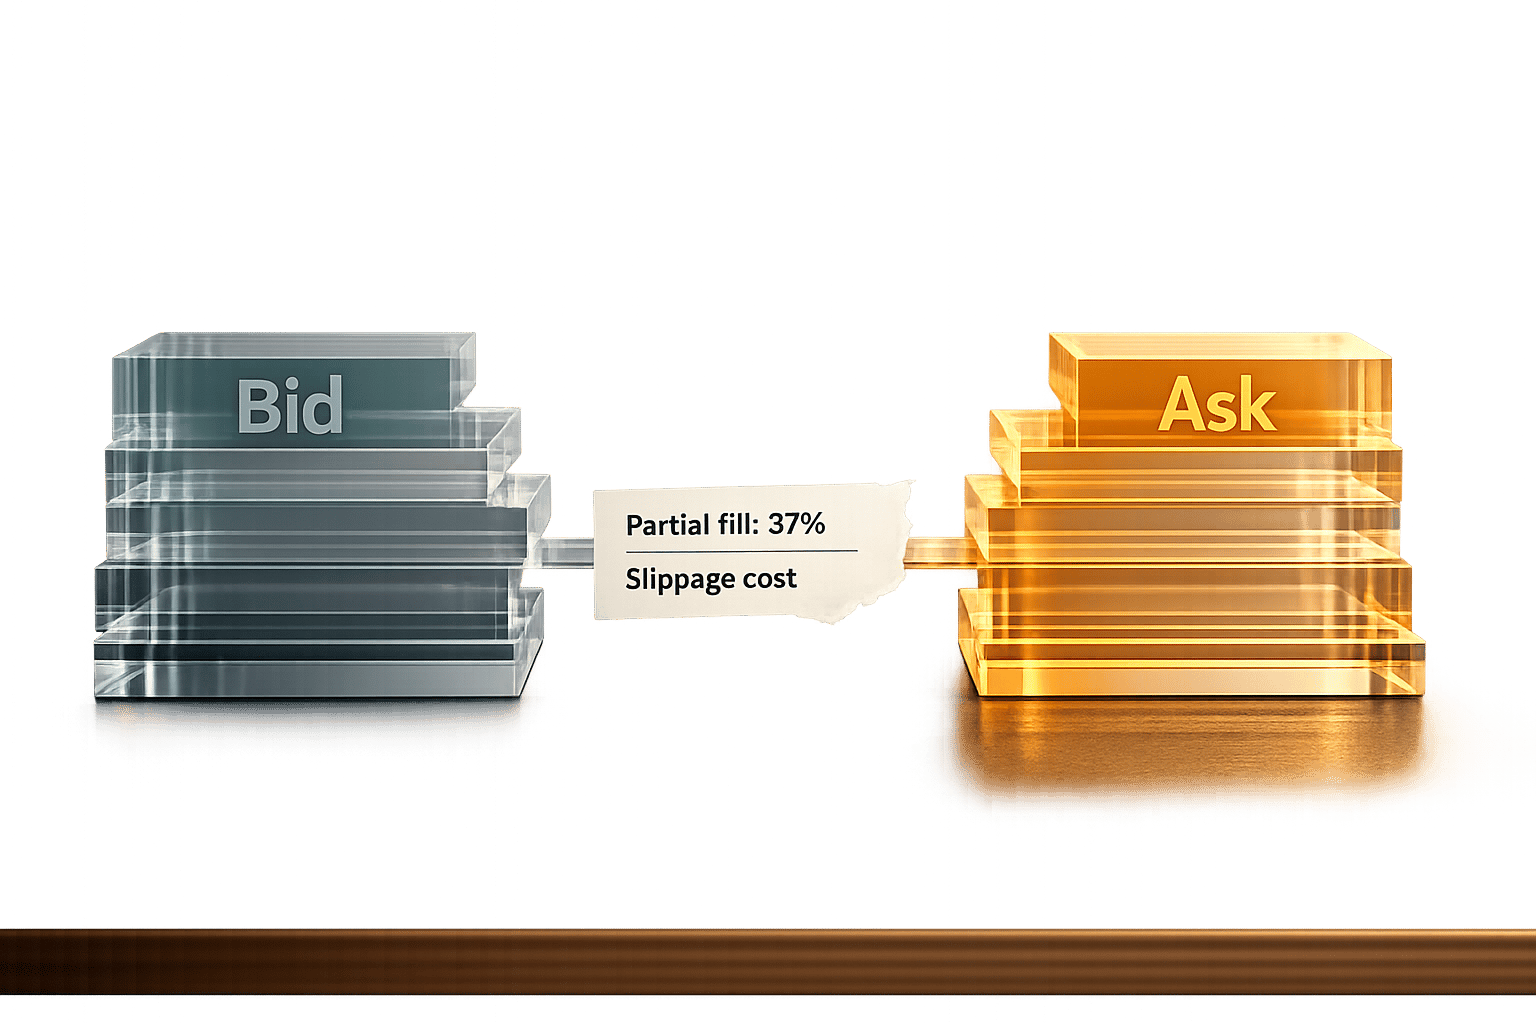
Backtesting in low-volume markets often fails to reflect real trading conditions. Why? These markets have thin order books, wide bid-ask spreads, and irregular price movements. Most backtesting tools wrongly assume trades execute instantly at historical prices, ignoring critical factors like slippage, partial fills, and market impact. This creates a gap between simulated results and actual performance.
Key Takeaways:
- Slippage: In low-liquidity markets, slippage can range from 0.15% to over 5%, drastically affecting profitability.
- Order Size: Large orders can sweep through multiple price levels, worsening execution prices.
- Data Quality: Sparse trading activity leads to misleading price bars, distorting technical indicators.
- Hidden Costs: Wide spreads and market impact can turn a profitable strategy into a losing one.
To create realistic backtests:
- Limit orders to 1%-5% of an asset's average daily volume.
- Use variable slippage models based on order size and volatility.
- Rely on granular data (tick or one-minute) for accuracy.
- Include metrics like fill ratio and realized price gaps to measure execution quality.
Tools like Traidies can help integrate liquidity-aware rules, automate slippage adjustments, and test strategies under realistic conditions. Always factor in market constraints to avoid surprises when trading live.
How Low Liquidity Distorts Backtest Results
The Problem with Fill Assumptions
Backtesting engines often assume that orders are filled instantly at historical prices. But in low-volume markets, the reality is far messier. Orders may sweep across multiple price levels, leading to partial fills and less favorable execution. Instead of a clean, single price, live trading results in a weighted average execution price that can significantly differ from backtested assumptions. Adding to this, live markets operate under FIFO (First In, First Out) rules, meaning queued orders might miss optimal prices entirely - a detail often overlooked in backtests.
"A backtest is not a simulation of the market; it is a simulation of your code running against dead, static numbers. The live market is a living, breathing ecosystem designed to extract liquidity from poorly constructed execution logic." - Jay J., Nova Quant Lab
These flawed assumptions about fills can magnify hidden costs, which we’ll dive into next.
Hidden Transaction Costs
In thin markets, wide spreads and market impact can quickly turn a seemingly profitable strategy into a losing one. Even a small spread - like 10 basis points - can wipe out a 5-basis-point edge. Backtests rarely account for market impact, which is the price movement caused by your own order in a low-liquidity environment.
"A strategy that trades 10% of average daily volume in a single session is not a price taker. It's a price mover." - cobweb.market
What looks like a robust profit in a backtest often crumbles under the weight of real-world market friction. For strategies relying on high-frequency trading, even a modest slippage of 0.05% per trade can slash profitability by 50%.
And it’s not just transaction costs that skew backtest results - poor data quality adds another layer of distortion.
Data Gaps and Misleading Price Bars
Low-liquidity markets often generate sparse trading activity, which gets condensed into standard OHLC (Open-High-Low-Close) bars. These bars tell you the price, but they leave out critical details like the available size at each level. Worse, the "close" price might reflect a one-off trade that doesn’t represent broader market dynamics.
As Sarah Hayes of MoneyPulses explains, "Historical candles show prices, not available size". This lack of detail can mislead technical indicators like RSI, moving averages, and VWAP, which are built on these incomplete data points. Signals that appear actionable in a backtest might be entirely unrealistic in a live, thinly traded market.
sbb-itb-3b27815
Common Backtesting Mistakes in Low-Volume Markets
Slippage by Asset Type: Typical vs. Stress Conditions
Ignoring Volume and Order Book Limits
A frequent pitfall in backtesting is using position sizes that exceed what the market can realistically handle. Backtesting engines often assume that orders are filled instantly at the best price, but in low-volume markets, this is far from reality.
In such markets, placing an order too large for the available depth can sweep through multiple price levels, resulting in a worse average fill. To avoid this, it's a good idea to keep orders within 1%–5% of the asset's average daily volume (ADV). Ignoring this guideline can lead to backtests that look promising on paper but crumble when actual money is at stake. This mismatch between assumed and real liquidity can lead to significant errors in evaluating a strategy.
Applying Liquid-Market Rules to Illiquid Assets
Another common error is applying assumptions from liquid markets to illiquid ones, such as microcaps or thinly traded cryptocurrencies. These assumptions often don't hold up.
"A backtest doesn't know how large your position is relative to the instrument's liquidity. A strategy that works beautifully with 1 lot... might fail at 50 lots due to market impact." - Bhavin Javia, Founder, BotJockie
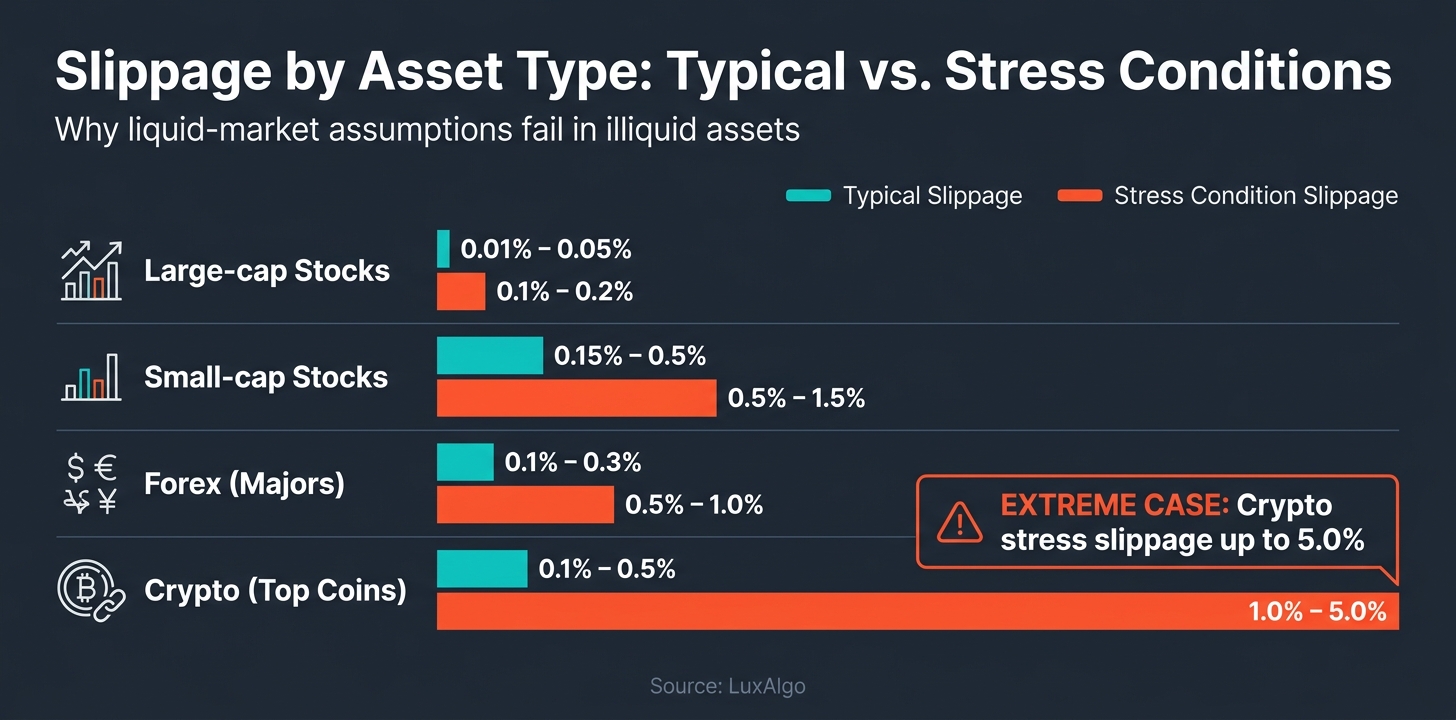
The difference in slippage between asset classes is particularly striking, especially under stress conditions. The table below shows how slippage varies across different types of assets:
| Asset Type | Typical Slippage | Stress Condition Slippage |
|---|---|---|
| Large-cap Stocks | 0.01% – 0.05% | 0.1% – 0.2% |
| Small-cap Stocks | 0.15% – 0.5% | 0.5% – 1.5% |
| Forex (Majors) | 0.1% – 0.3% | 0.5% – 1.0% |
| Crypto (Top Coins) | 0.1% – 0.5% | 1.0% – 5.0% |
Source: LuxAlgo
This variability underscores the importance of realistic assumptions. For example, using a fixed 0.1% slippage rate might work for a major forex pair but would be overly optimistic for a thinly traded altcoin. As Christopher Downie of LuxAlgo points out, "Including realistic slippage can trim simulated returns by 0.5–3 percent per year – a vital adjustment for credible trading plans."
Overfitting to Illiquid Market Noise
Low-volume markets are prone to erratic and sparse price movements, which can easily be mistaken for patterns. This leads to another major issue: overfitting. When traders test numerous variations on limited data, some strategies may appear profitable purely by chance due to data mining bias.
For instance, a strategy showing a Sharpe ratio of 1.5 across 500 trials might have less than a 50% chance of being genuinely profitable once multiple testing is accounted for. The solution? Validate on out-of-sample data and set a higher statistical threshold, such as a t-statistic of 3.0 instead of the usual 2.0. If a strategy falls apart when you tweak a moving average from 50 to 55, it's likely overfitted to historical noise rather than identifying a sustainable signal.
How to Build More Accurate Backtests for Low-Volume Markets
Creating realistic backtests in low-volume markets requires addressing the unique challenges these markets present. Let's explore some strategies to refine your simulations.
Sizing Positions Based on Available Liquidity
Start by sizing your positions with liquidity in mind. Limit your orders to 5% of the average daily volume (ADV) to ensure the market can reasonably absorb your trade without excessive impact. Exceeding this threshold often results in sweeping multiple price levels, which can distort your simulated fills.
Partial fills are another key consideration. In illiquid markets, assuming that only 60–80% of your desired order size gets filled on larger trades is far more realistic than expecting full execution. Additionally, you can introduce a "kill rate" in your simulations, rejecting 1–2% of orders to mimic real-world issues like broker connectivity problems or exchange halts.
Accounting for Spreads, Slippage, and Market Impact
Modeling slippage accurately is crucial. Fixed slippage rates, like 0.1%, are often too optimistic for thin markets. Instead, implement a variable slippage model that adjusts based on factors such as order size, volatility, and historical bid-ask spreads.
For market impact, consider this insight from quantitative researcher Om Arora:
"Market impact scales approximately with the square root of the order size relative to average daily volume."
This principle, known as Kyle's square-root law, is a practical way to estimate how much your order might move the price before it's fully filled. To stress test your model, try doubling slippage estimates and increasing spreads by 50%.
Using Granular, High-Quality Data
Granularity in data is essential for capturing the nuances of low-volume markets. Coarse data, such as daily or hourly bars, often misses critical details. Instead, use tick-level or one-minute data, which can capture bid-ask bounces, micro-volatility, and short-term order book imbalances.
For example, a mean reversion study on Apple revealed a drop in expectancy from $45 to $8 per 1,000 shares when realistic partial fills and a slippage of 0.5 ticks were applied. This highlights how granular data can significantly impact backtesting accuracy.
Don't forget to clean your data. Remove erroneous ticks and include delisted or bankrupt companies in your dataset to avoid overestimating returns by 2–4%.
| Data Type | Granularity | Best Use Case |
|---|---|---|
| Bar Data (OHLC) | Low (1m, 5m, 1h) | Long-term swing strategies; rapid prototyping |
| Tick Data (Level 1) | Medium (every price change) | Scalping, intraday strategies, realistic spread modeling |
| Depth Data (Level 2/3) | High (order book events) | Large order impact simulation, market making |
These steps provide a solid foundation for building more realistic backtests, setting the stage for advanced techniques like AI-driven liquidity-aware simulations in future discussions.
Using AI and Automation for Liquidity-Aware Backtests
AI tools are transforming how traders handle the challenges of backtesting in illiquid markets. Instead of relying on manual tweaks - like adjusting for slippage or modeling partial fills - AI can embed liquidity rules directly into your trading strategies. This shift makes strategy coding more precise and less prone to errors.
Encoding Liquidity Rules in Natural-Language Strategy Descriptions
Platforms such as Traidies allow traders to describe their strategies in plain language, which the platform then converts into MQL5 code. This approach lets you include liquidity rules right at the start. For example, you could specify: "Only execute trades when volume exceeds the 20-period average, and limit each order to 5% of average daily volume." The AI interprets these instructions and integrates them into the generated code.
This feature addresses a common problem: traders often consider liquidity when designing strategies but fail to encode those rules into the actual code. Natural-language inputs ensure that liquidity constraints are included from the beginning, leaving no room for oversight.
Setting Up Backtests for Illiquid Market Conditions
Once your strategy is coded, the next step is setting up backtests that reflect actual trading conditions. Instead of manually adjusting for fixed slippage, Traidies automates the process by incorporating variable slippage and session-based filters. These adjustments account for factors like order size, volatility, and session timing while excluding periods of low liquidity - all of which are built into the strategy description. For instance, a strategy targeting small-cap stocks might include a slippage allowance of 0.75% to 1%.
Traidies also uses historical data to automate backtesting, allowing you to fine-tune cost parameters and stress-test your strategy. A smart practice is to add 20% more slippage than anticipated to see how the strategy performs under less-than-ideal conditions.
For the most accurate results, use the "Every Tick Based on Real Ticks" modeling option instead of synthetic tick data. This method captures spread widening and price spikes that traditional OHLC bars might miss.
"If your P&L doesn't account for spread, slippage, realistic tick modeling, and broker execution quirks, you're essentially trading fiction." - Luka, Co-Founder, Tradyx.ai
Measuring Performance with Liquidity Metrics
After applying automated liquidity constraints, it's essential to evaluate their impact on your trading execution. Key metrics help you measure how well your strategy performs under liquidity-aware conditions. The most critical ones are the fill ratio (the percentage of requested orders successfully executed) and the realized vs. theoretical price gap (the cost of slippage and latency).
Beyond these, you should monitor two additional metrics: Maximum Adverse Excursion (MAE), which highlights how far the price moves against a trade before it closes, and the Ulcer Index, which penalizes strategies for prolonged drawdowns caused by liquidity issues. These metrics offer a deeper understanding of how liquidity constraints affect your strategy’s performance - not just its overall returns.
| Metric | What It Measures | Why It Matters in Low-Volume Markets |
|---|---|---|
| Fill Ratio | Realized vs. requested order size | Identifies risks of partial fills on larger orders |
| Realized vs. Theoretical Price | Difference between signal price and actual fill price | Quantifies the true cost of slippage and latency |
| Maximum Adverse Excursion (MAE) | Worst price movement against a trade before closure | Exposes risks from poor liquidity exits |
| Ulcer Index | Depth and duration of drawdowns | Highlights strategies with slow recoveries due to liquidity issues |
Conclusion: Setting Realistic Expectations for Low-Volume Strategies
Backtesting in low-volume markets often falters because engines assume unrealistic conditions - like unlimited liquidity, flawless order fills, and no market impact. As Jay J., Risk Management Expert at Nova Quant Lab, explains:
"A backtest is not a simulation of the market; it is a simulation of your code running against dead, static numbers."
This disconnect can shave 0.5%–3% off simulated annual returns, making it necessary to apply a 30%–50% reduction to backtested results.
To address these challenges, you can incorporate liquidity constraints directly into your strategy. This might include adjusting position sizes, accounting for variable slippage, and using real tick data. These adjustments help align backtests more closely with the realities of live trading.
Tools like Traidies make this process easier. They allow you to define liquidity rules in plain language, automate slippage adjustments, and backtest with realistic historical data. This ensures you confront market frictions before moving to live trading, reducing the risk of unpleasant surprises.
FAQs
How can I estimate market impact in a low-volume asset?
To gauge the market impact of trading low-volume assets, it's crucial to simulate realistic trading conditions during backtesting rather than assuming flawless trade execution. This means working with detailed order book data, such as Level 2 or Level 3, to study key factors like bid-ask spreads, order depth, and order flow.
Additionally, implementing variable slippage models can help reflect how order size and liquidity affect execution prices. Don't forget to factor in execution delays, as these can significantly influence the actual market impact and provide a more accurate picture of trading outcomes.
What’s the minimum data granularity I should use for illiquid backtests?
When running backtests for illiquid assets, it's crucial to use data with at least 1-minute granularity. This level of detail helps capture important intraday factors like liquidity and slippage, which are often missed with lower resolutions such as daily bars. Using coarser data can lead to misleading results, as it doesn't accurately represent the nuances of intraday market behavior.
Which execution metrics matter most beyond P&L in thin markets?
In thin markets, execution metrics beyond just profit and loss (P&L) play a crucial role in assessing a trading strategy's effectiveness. Key metrics to focus on include:
- Slippage: The difference between the expected price of a trade and the actual price at which it is executed. In low-volume markets, slippage can be more pronounced due to limited liquidity.
- Liquidity: The ease with which assets can be bought or sold without causing a significant change in price. Thin markets often have lower liquidity, increasing the challenge of executing large orders efficiently.
- Order Fill Quality: This measures how well orders are executed in terms of speed and price. Poor fill quality can lead to higher costs and missed opportunities.
- Market Impact: The influence a trade has on the market price. In less liquid markets, even small trades can cause noticeable price movements, affecting overall strategy performance.
These metrics are essential for evaluating how well a trading approach performs under the unique conditions of low-volume markets. They help traders understand the hidden costs and risks that might not be immediately visible through P&L alone.