Parsing Market Data for MQL5: Step-by-Step

Parsing Market Data for MQL5: Step-by-Step
Want to improve your MQL5 trading strategies? Start with better market data parsing. This guide breaks down how to turn raw price updates into actionable insights, ensuring your strategies are precise and efficient. Here's what you'll learn:
- Tick Data vs. Historical Bars: When to use
MqlTickfor real-time updates andMqlRatesfor aggregated data. - Handling Missing Ticks: Why
OnTick()may skip updates and howCopyTicks()ensures nothing is missed. - Symbol Properties: Use
SymbolInfoTick()for consistent snapshots of market data. - External Feeds: Fetch and parse JSON API data for broader market context.
- Data Cleaning: Validate and filter anomalies like empty order books or incomplete tick data.
- Custom Structures: Organize raw data into formats like directional volume for deeper analysis.
MQL5 Access Previous Bar Data (High, Low, Open, Close, ...)
sbb-itb-3b27815
Market Data Inputs in MQL5
MQL5 provides several types of market data that are essential for developing trading strategies. Each type serves a unique purpose, depending on the requirements of your trading logic.
Tick Data and Historical Bars
Tick data captures every single price movement with millisecond accuracy. In contrast, historical bars consolidate tick data into a single record containing open, high, low, and close prices, grouped over a specified time interval (e.g., M1 or H1).
The choice between these two depends on what your strategy needs:
| Feature | Tick Data (MqlTick) |
Historical Bars (MqlRates) |
|---|---|---|
| Granularity | Individual price changes | Aggregated over fixed intervals |
| Time Precision | Milliseconds | Seconds (bar open time) |
| Price Fields | Bid, Ask, Last | Open, High, Low, Close |
| Best For | Scalping, spread analysis, volume delta | Trend analysis, standard indicators |
| Array Indexing | 0 = oldest | 0 = most recent |
- The MetaTrader 5 terminal maintains a fast-access cache of the last 4,096 ticks per instrument, which expands to 65,536 ticks for symbols with active Depth of Market data. Tick history is stored in
.TKCfiles on a monthly basis, which can consume significantly more disk space compared to historical bars.
With these data structures in mind, refining your market insights often involves leveraging symbol properties.
Symbol Properties and Their Role
Symbol properties provide critical real-time metadata, such as spread, point size, session timings, and volume limits. These can be accessed using functions like SymbolInfoDouble() and SymbolInfoInteger(). For efficiency, you can also use SymbolInfoTick(), which retrieves multiple pieces of information in a single call.
Using SymbolInfoDouble() separately for SYMBOL_BID and SYMBOL_ASK can lead to inconsistencies if a new tick arrives between calls. To avoid this, rely on SymbolInfoTick() for an atomic snapshot. When calculating spreads, normalize the price difference using SYMBOL_POINT. This ensures your calculations adapt to instruments with varying levels of precision.
For Forex instruments, keep in mind that SYMBOL_LAST and SYMBOL_VOLUME often remain zero because most Forex markets don’t report centralized trade data.
In addition to native data, external feeds can complement your market analysis.
External Market Feeds via JSON APIs
While MQL5's built-in data is sufficient for most strategies, there are times when external information - like economic events, sentiment data, or prices from non-broker exchanges - can provide additional context. You can use MQL5’s WebRequest() function to fetch data from HTTP endpoints and parse JSON strings. However, be mindful of the latency involved, which makes this method better suited for lower-frequency signals, such as session-level filters or macroeconomic event indicators, rather than high-frequency trading logic.
When integrating external feeds with MQL5’s native data, it’s critical to keep the two data streams separate in your code. This avoids potential confusion with timestamps or price formats, ensuring your strategy remains accurate and reliable.
Data Structures for Parsing in MQL5
Before diving into parsing logic, it’s essential to get familiar with the two main structures provided by MQL5: MqlTick and MqlRates. These aren't just containers for market data - they determine how that data is processed.
Using MqlTick and MqlRates
The MqlTick structure is designed for real-time market updates. Each tick contains key details like Bid, Ask, Last, and Volume, even if only one of these values has changed. The time_msc field offers millisecond-level precision, which is critical for strategies that demand accuracy. Additionally, the flags field acts as a bitmask to indicate which parameter has changed, allowing you to focus calculations only where necessary.
On the other hand, MqlRates handles historical bar data. It captures standard OHLC prices along with tick_volume, spread, and real_volume for each bar. For Forex instruments, however, real_volume is typically zero since centralized trade volume isn’t reported. Instead, tick_volume provides a reliable measure.
Here’s a quick comparison:
| Structure | Primary Use | Key Fields |
|---|---|---|
MqlTick |
Real-time price changes | bid, ask, last, volume, time_msc, flags |
MqlRates |
Historical bar data | open, high, low, close, tick_volume, spread |
Pro Tip: Always check the flags field in MqlTick before performing calculations. This can save processing time by skipping unchanged values.
These structures make it easier to retrieve and process large volumes of data efficiently, as we’ll see in the next section.
Arrays and Custom Structs
To handle bulk market data, you can load these structures into dynamic arrays using CopyTicks() for tick data or CopyRates() for bar data. Before fetching large datasets, it’s a good idea to use ArrayResize() to prevent performance bottlenecks during high-volume data pulls.
Keep in mind how arrays are indexed. By default, MQL5 uses forward indexing, meaning index 0 represents the oldest element. However, for most trading logic, it’s more intuitive to reverse this order using ArraySetAsSeries(), so index 0 points to the most recent tick or bar.
When the built-in structures fall short, custom structs can fill the gap. For example, you might create a DeltaVolumePerBar struct with fields like datetime time, ulong buy, ulong sell, and long delta. By iterating over a MqlTick array and analyzing the TICK_FLAG_BUY and TICK_FLAG_SELL bits, you can calculate order flow imbalances or other advanced metrics that standard bar data doesn’t provide.
This flexibility allows you to extract deeper insights from market data, tailoring your parsing logic to your strategy’s needs.
Step-by-Step: Parsing Tick Data in MQL5
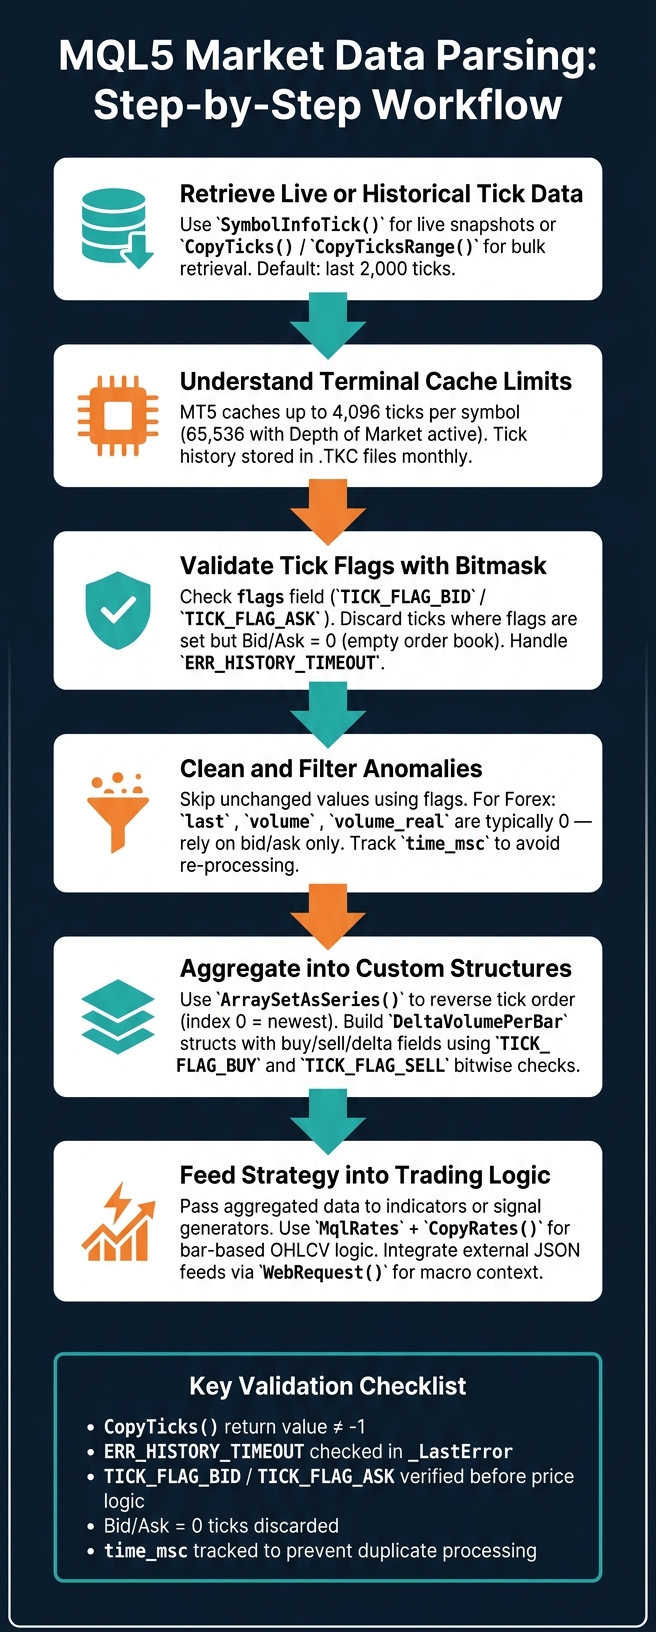
MQL5 Market Data Parsing Workflow: From Raw Ticks to Trading Signals
Retrieving Live Tick Data
To access the latest tick data, the SymbolInfoTick() function is your go-to. It populates a single MqlTick structure with critical details like Bid, Ask, Last, Volume, and a timestamp for a specific symbol. Most Expert Advisors (EAs) use this within the OnTick() event to handle incoming price updates as they occur.
However, during periods of high market activity, OnTick() might not capture every single tick. If your strategy requires processing every price movement without missing any, you should use the CopyTicks() function. By setting the from parameter to 0, you can retrieve the most recent ticks, up to the number specified in the count parameter. If count is omitted, the function will return the last 2,000 ticks by default.
Note: For information about tick cache limitations in the terminal, refer to the earlier section titled "Tick Data and Historical Bars."
For more in-depth analysis over a specific timeframe, you can use CopyTicksRange(), which allows you to retrieve ticks for a defined period.
Processing Historical Tick Data
The CopyTicksRange() function is perfect for analyzing tick data within a specific time window, whether you're replaying a trading session or examining activity during a particular hour.
Ticks are stored in chronological order, with index 0 representing the oldest tick. This is different from how bar data is ordered, so be mindful of the direction in which you iterate through the data. For Forex instruments, fields like last, volume, and volume_real will often be zero. Instead, focus on changes in the bid and ask prices for your logic.
When processing tick data in chunks, ensure you avoid re-processing ticks you've already handled. To do this, store the time_msc value of the last tick you processed. For your next CopyTicks() call, use prev_time_msc + 1 as the starting point. If multiple ticks share the same millisecond timestamp, track the processed count and skip duplicates during subsequent retrievals.
Validating and Cleaning Tick Data
After retrieving tick data, validation and cleaning are crucial to maintain the reliability of your trading logic. Since MQL5 populates all fields in MqlTick for every tick - even when only one value changes - use the flags bitmask to validate the data before processing it. For instance, a Bid price that appears updated might simply be carried over from the previous tick.
Pay close attention to two specific anomalies:
- Empty Order Book: If both
TICK_FLAG_BIDandTICK_FLAG_ASKare set but the Bid and Ask prices are zero, this indicates an empty order book. These zeros should not be treated as valid prices. - Synchronization Timeout: Always check
_LastErrorafter callingCopyTicks(). AnERR_HISTORY_TIMEOUTerror means the server didn't synchronize within the 45-second limit, so the dataset may be incomplete.
Here’s a quick reference for validating tick data:
| Validation Check | What to Look For | Action |
|---|---|---|
| Flag-based filtering | TICK_FLAG_BID / TICK_FLAG_ASK not set |
Skip price update logic |
| Empty order book | Flags set but Bid/Ask = 0 | Discard tick |
| Sync timeout | ERR_HISTORY_TIMEOUT in _LastError |
Re-request or flag data as partial |
| Forex volume fields | last, volume, volume_real = 0 |
Expected; rely on bid/ask only |
| Return check | CopyTicks() returns -1 |
Handle error before iterating |
Parsing JSON Data from External Market Feeds
MQL5's built-in functions are great for handling native data, but when you need to work with external JSON feeds, things get a bit more involved. Since MQL5 doesn’t come with a built-in JSON parser, you’ll need to set up additional tools to fetch and process data from APIs. It all begins with the WebRequest() function, which supports both GET and POST methods. However, before using it, you need to add the API's URL to the "Allow WebRequest for listed URL" section in MetaTrader 5 (navigate to Tools > Options > Expert Advisors). Skipping this setup results in error 4060.
Once you receive a response, convert the raw byte array into a readable string using CharArrayToString() with the CP_UTF8 encoding. This ensures special characters are preserved. Always verify that the HTTP status code is 200 before proceeding - anything else indicates a failed request, and attempting to parse such data will only lead to errors. By following this workflow, you can seamlessly integrate external data with MQL5's native tick processing.
"Mixing external data could improve decision-making in algorithm trading... access news feeds or social sentiment analysis, online artificial intelligence tools, or online forecast systems." - Sara Sabaghi, Developer
Reading JSON Fields
After successfully fetching data with WebRequest(), the next step is extracting the fields you need from the JSON response. Using a third-party library like JAson.mqh simplifies this process, allowing you to retrieve fields with commands like JsonValue[21]["Symbol"].ToStr() - especially useful for nested or complex JSON structures.
For simpler responses, where only a few fields like "signal", "sl", or "tp" are needed, lightweight methods such as StringFind() and StringSubstr() can be faster and more efficient.
Here’s a practical example: pulling BTCUSDT candlestick data from the Binance API, then organizing the Open, High, Low, and Close prices into separate arrays. These arrays can then feed into custom indicators.
Type Conversion and Error Handling
JSON fields usually come as strings, so you’ll need to convert them into appropriate types for calculations. Here’s a quick guide to common conversions:
| JSON Data Type | MQL5 Target Type | Conversion Function |
|---|---|---|
| String | string | CharArrayToString() |
| Number (decimal) | double | StringToDouble() |
| Number (integer) | int / long | StringToInteger() |
| Boolean | bool | Check for "true" or "false" manually |
| Timestamp (ms) | datetime | (datetime)(value / 1000) |
For timestamps, divide the value by 1000 before casting it to datetime. Also, set a timeout of 2000–5000 ms in your WebRequest() calls to prevent delays in your Expert Advisor due to slow API responses. To avoid exceeding API rate limits, consider saving responses locally using FileOpen() and FileWriteArray(). You can then check the file’s last modification time to decide whether a new request is necessary.
Preparing Data for Trading Logic
Once your data is cleaned, the next step is to structure it for practical use in trading strategies. While raw MqlTick data provides highly detailed, chronological information, it often requires restructuring to be useful for indicators or signal generation.
Structuring Data for Indicators and Signals
To ensure your data aligns with the way indicators process information, you’ll need to reverse the tick order. This can be done using ArraySetAsSeries(), which flips the default order so that the most recent data appears at index 0. This adjustment ensures your data behaves consistently with standard chart mechanics.
In addition to reordering, raw tick data often needs to be aggregated to make it actionable. For example, you can use custom structures like DeltaVolumePerBar to group data into more meaningful chunks. To determine trade direction, flags in tick data can be checked using bitwise operations, such as (tick.flags & TICK_FLAG_BUY) != 0. Since multiple flags can be active on a single tick, bitwise operations are the most reliable way to accurately interpret these flags.
For Forex traders, where real exchange volume is typically unavailable, you can estimate directional volume. This involves analyzing whether the average price (Ask + Bid) has moved up or down between consecutive ticks. While not perfect, this method provides a practical way to infer volume direction for use in indicators.
By aggregating and structuring your data, you simplify indicator inputs and reduce the noise that raw tick data often introduces.
Comparing Raw vs. Parsed Data
Here’s a quick comparison to highlight the benefits of structuring your data:
| Feature | Raw MqlTick |
Structured (e.g., DeltaVolumePerBar) |
|---|---|---|
| Granularity | Individual ticks (ms) | Aggregated per timeframe (H1, M15, etc.) |
| Volume Info | Total volume of the last deal | Separated net buy vs. net sell volumes |
| Indexing | Chronological (0 = oldest) | Timeseries (0 = newest/current bar) |
| Primary Use | High-frequency analysis, scalping | Trend strength, volume delta indicators |
While raw MqlTick data offers a wealth of detail, its granularity can overwhelm most indicators, generating excessive noise. By structuring and aggregating the data, you enable your strategy to focus on the key elements - direction, momentum, and intent - rather than being distracted by every micro-movement in price.
Using Traidies for Automated Strategy Development

Once your data is properly organized and structured, the next step is creating a trading strategy. Traditionally, bridging the gap between understanding your data and building an Expert Advisor involves tedious manual work - like synchronizing data, handling tick flags, and managing complex structures. Traidies simplifies this process by automating the transition from data parsing to strategy execution.
AI-Driven MQL5 Code Generation
Traidies enables you to describe your trading strategy in plain English, and it takes care of generating the corresponding MQL5 code for you. This includes all the intricate data-handling logic you'd typically have to program manually. Its AI Strategy Parser analyzes your input and produces a functional Expert Advisor based on your description.
This tool becomes especially handy once you’ve deciphered your parsed data. For instance, if you know which tick flags indicate buy or sell signals or how to calculate volume delta for each bar, Traidies allows you to turn that understanding into a fully operational Expert Advisor - without writing a single line of code yourself.
Backtesting Strategies with Historical Data
Creating a strategy is only part of the equation - validating it is just as important. Testing your strategy against historical data ensures its reliability, but this process can be resource-intensive. For example, running the BandOsMATicks.mq5 Expert Advisor on EURUSD using 31,002,919 real ticks (from January 2021 to June 2022) took 2 minutes and 45 seconds, used 835 MB of memory, and achieved a profit factor of 1.32. By switching to "Sequence" filtered mode, the tick count was reduced to 16,310,236, cutting the testing time and memory usage in half while maintaining a similar profit factor.
Traidies also streamlines backtesting by automating the process with historical data. You can validate both your data pipeline and strategy logic without needing to manually adjust tick density or define custom symbol properties. While "real tick" mode provides the most accurate results for final validation, filtered modes offer a faster, more efficient way to test during development cycles.
Conclusion: Key Takeaways for Parsing Market Data in MQL5
Parsing market data in MQL5 revolves around one core idea: reliable trading strategies rely on clean, structured data. Without accurate data, even the most advanced trading logic can fail. MQL5 offers built-in structures that are essential for handling both real-time and historical data. For instance, the flags field in MqlTick helps identify which price component has changed, while MqlRates and CopyRates are ideal for working with bar-based OHLCV data. When dealing with external data feeds, robust JSON parsing combined with precise type conversion and error handling ensures a stable and dependable data pipeline. Turning raw tick data into actionable insights is the foundation of effective trading strategies.
MetaTrader 5’s ability to cache up to 4,096 ticks per instrument - or 65,536 ticks when Depth of Market is active - plays a critical role in optimizing data retrieval. Always validate the returns from functions like CopyTicks or CopyTicksRange, and monitor _LastError to manage incomplete or missing data effectively. These steps are essential for building a reliable structure for more complex data analysis.
Additionally, wrapping raw tick data into custom structures, like a DeltaVolumePerBar struct, can provide deeper insights. By isolating buy and sell volumes per bar, traders can uncover patterns that go beyond standard OHLCV data. This structured approach is what separates strategies that succeed in backtesting from those that thrive in live trading environments.
Platforms like Traidies take these principles a step further, offering tools for AI-driven code generation and automated backtesting. By streamlining the technical aspects of data parsing and strategy development, Traidies allows traders to focus on fine-tuning their strategies rather than troubleshooting data issues.
FAQs
When should I use CopyTicks() instead of relying on OnTick()?
When you need historical tick data for a specific time range - like when you're backtesting strategies or reviewing past market activity - CopyTicks() is your go-to function. It delivers an array of tick data for a defined period, making it perfect for analyzing historical trends.
On the other hand, OnTick() is designed for real-time trading. It activates whenever a new tick arrives, helping you make live trading decisions based on current market activity.
In short, use CopyTicks() for digging into the past, and OnTick() for staying on top of the present.
How can I avoid inconsistent Bid/Ask reads when calculating spread?
To ensure accurate Bid/Ask readings in MQL5, rely on the MqlTick structure. This approach gives you synchronized bid and ask prices, eliminating discrepancies. Always retrieve and process both values from the same tick using functions like SymbolInfoTick(). Mixing data from different ticks or timeframes can lead to inaccurate spread calculations and fail to reflect the true market state at that exact moment. Stick to synchronized data for precision.
What’s the safest way to handle missing or 'zero' ticks in MqlTick data?
When working with tick data in your trading logic, it's crucial to verify that the relevant fields are non-zero before using them. Depending on the instrument, some fields might consistently be zero. By validating this data, you can avoid acting on invalid or incomplete information, ensuring your Expert Advisor or trading application handles data more reliably.