Walk Forward Analysis vs. Out-of-Sample Testing

Walk Forward Analysis vs. Out-of-Sample Testing
When developing trading strategies, avoiding overfitting is critical. Two key methods for validation are Out-of-Sample Testing and Walk Forward Analysis. Here's a quick breakdown:
- Out-of-Sample Testing splits historical data into two parts: one for training and one for testing. It ensures your strategy performs on unseen data but relies on a single, static data split, which can lead to biased results.
- Walk Forward Analysis uses rolling or anchored windows to repeatedly optimize and test strategies over time. This approach better reflects changing market conditions but requires more computational resources.
Key Differences:
- Out-of-Sample Testing: Simple, fast, but static.
- Walk Forward Analysis: More detailed and dynamic, but computationally intensive.
Quick Comparison:
| Feature | Out-of-Sample Testing | Walk Forward Analysis |
|---|---|---|
| Data Usage | Single split (e.g., 70/30) | Multiple rolling/anchored windows |
| Testing Frequency | One-time | Multiple cycles |
| Market Conditions | Static | Reflects changing conditions |
| Parameter Stability | Not assessed | Monitored across windows |
| Effort Required | Low | High |
For simple strategies, start with Out-of-Sample Testing. For more complex, parameter-heavy systems, Walk Forward Analysis provides deeper insights into performance over time.
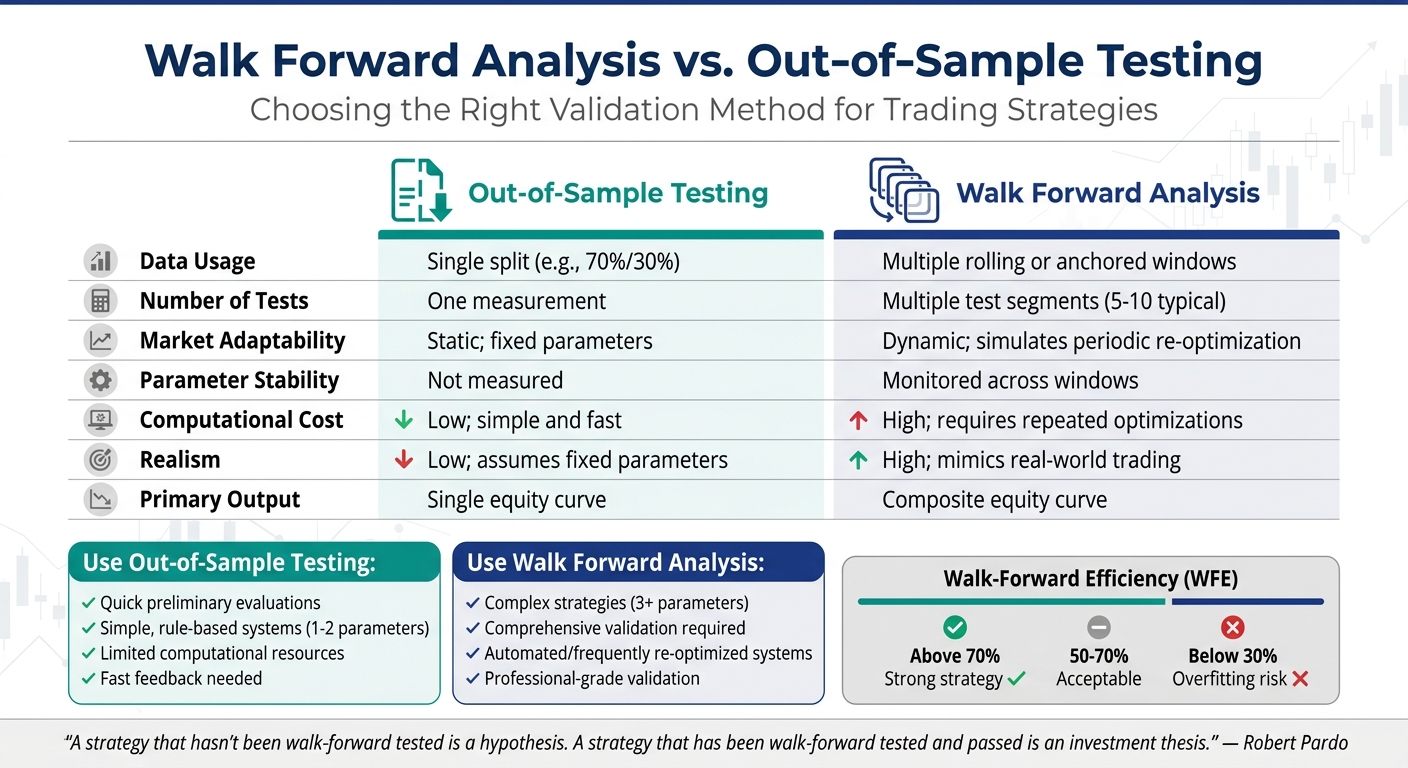
Walk Forward Analysis vs Out-of-Sample Testing: Key Differences Comparison
Out-of-Sample Testing: How It Works and Its Limits
The Basics of Out-of-Sample Testing
Out-of-Sample (OOS) Testing divides historical data into two main parts. The first, called the In-Sample (IS) period, is where you develop and optimize your trading strategy. Think of it as the "training set" - this is where you tweak parameters like moving averages or stop-loss levels to refine your approach. The second part, the OOS period, is reserved for validation. This is where you test your strategy on data it hasn’t encountered before to see if it holds up under fresh conditions.
Common splits for this method include 70/30 or 60/40, though some traders opt for a 60/20/20 split to add an extra layer of validation. The key is to run your strategy on the OOS data only once - repeated testing risks introducing data snooping bias. If your strategy performs consistently across both IS and OOS periods, maintaining 50–60% of its in-sample profit factor, it’s a good sign that it captures a real market edge. However, a steep drop in OOS performance usually signals overfitting. While this testing approach is straightforward, it comes with limitations that can sometimes distort the true picture of a strategy’s effectiveness.
Where Out-of-Sample Testing Falls Short
One major drawback of OOS testing is its reliance on a single, arbitrary data split. If the OOS period happens to align with favorable market conditions for your strategy - say, a trend-following system tested during a bull market - the results may look better than they actually are. On the flip side, an unfavorable split can make a solid strategy appear weak. This approach only evaluates performance in one type of market environment, leaving gaps in understanding how the strategy might handle other scenarios, like high volatility or sudden regime changes. Another flaw is the assumption that the parameters optimized during the training phase will remain effective indefinitely.
As Robert Pardo, author of The Evaluation and Optimization of Trading Strategies, explains:
"A strategy that hasn't been walk-forward tested is a hypothesis. A strategy that has been walk-forward tested and passed is an investment thesis. There's a world of difference."
For example, an EMA crossover strategy showed significant shifts in its "optimal" parameters when moving from full-period optimization to segmented OOS testing. This highlighted how easily overfitting can occur.
To address these issues, traders can test their strategies across multiple OOS periods or adopt Walk-Forward Analysis. Walk-Forward Analysis uses rolling tests to simulate how a strategy adapts to changing market conditions over time. Additionally, it’s crucial to confirm that your optimized parameters sit on a stable "plateau", where nearby values yield similar results. If the parameters instead form sharp peaks, it’s often a sign of overfitting. These adjustments pave the way for more adaptive methods like Walk-Forward Analysis.
sbb-itb-3b27815
Walk Forward Analysis: Method and Benefits
The Rolling Window Method
Walk Forward Analysis breaks historical data into overlapping windows that move through time. Each window has two key parts: an In-Sample (IS) training segment where strategy parameters are optimized, and an Out-of-Sample (OOS) testing segment where those parameters are validated on unseen data. Once a cycle is complete, the window shifts forward by a set interval - like a month or a quarter - and the process repeats until all historical data is analyzed.
There are two main approaches to structuring these windows: rolling windows and anchored windows. Rolling windows keep the lookback period fixed, advancing both the start and end dates. This method is ideal for dynamic markets, such as forex, where older data may lose relevance. Anchored windows, on the other hand, fix the start date while extending the end date, leveraging the full historical dataset as it progresses. This approach works well for strategies that depend on long-term structural trends.
Common training-to-testing ratios include 2:1, 3:1, and 4:1, with 3:1 often serving as the default to balance context and testing opportunities. For dependable outcomes, aim for at least 6 to 8 windows, though 12 to 20 windows are better if your dataset supports it. Additionally, each OOS window should include at least 30 trades to ensure results are statistically meaningful.
After completing the analysis for all windows, the results are combined to evaluate the overall robustness of the strategy.
Combined Test Results
The OOS results from all windows are aggregated into a composite equity curve. This curve reflects the performance you would realistically achieve by periodically re-optimizing your strategy in real-time. Unlike a single OOS test that provides just one result, this composite equity curve captures performance across diverse market conditions - such as trending, ranging, or volatile markets.
A key metric for assessing strategy robustness is Walk-Forward Efficiency (WFE), which measures the ratio of annualized OOS return to annualized IS return. A WFE above 70% is considered strong, 50%–70% is acceptable, and anything below 30% suggests overfitting. Another critical factor is parameter stability across the windows. If optimal parameters, like RSI periods or moving average lengths, vary greatly, it may indicate the strategy is fitting noise rather than identifying real market patterns. A coefficient of variation below 15% for these parameters suggests strong stability and the presence of a genuine market signal.
Walk-Forward Analysis: Your Ultimate Guide!
Main Differences Between Walk Forward Analysis and Out-of-Sample Testing
Let’s dive into how these two validation techniques differ, focusing on their structure, outputs, and practical implications.
The most noticeable difference lies in how they divide data and test frequency. Out-of-sample testing takes a straightforward approach: it splits data once - typically 70% for training and 30% for testing - and runs a single validation at the end of development. Walk Forward Analysis, however, divides the dataset into multiple overlapping windows, with each window undergoing its own optimization and testing cycle.
This difference in structure leads to distinct outputs. Out-of-sample testing generates a single equity curve, while Walk Forward Analysis creates a composite equity curve, which reflects performance across various market conditions. This broader perspective can provide deeper insights into how a strategy might behave in real-world scenarios.
"One observation is not a distribution. It cannot tell the developer whether that number is representative, lucky, or unlucky." - Falco Insights Editorial
Another key contrast is how each method handles changing market conditions. Out-of-sample testing assumes that the parameters optimized during the training phase will continue to perform well indefinitely. In contrast, Walk Forward Analysis mirrors real-world trading by re-optimizing the strategy as new data becomes available. This process highlights parameter stability - or instability - over time. If optimal parameters shift significantly between windows, it could signal that the strategy is picking up on noise rather than genuine market signals.
Comparison Table: Walk Forward Analysis vs. Out-of-Sample Testing
| Feature | Out-of-Sample Testing | Walk Forward Analysis |
|---|---|---|
| Data Usage | Single split (e.g., 70%/30%) | Multiple rolling or anchored windows |
| Number of Tests | One measurement | Multiple test segments (5–10 typical) |
| Bias Detection | Detects overfitting to training data | Assesses robustness of strategy and optimization process |
| Market Adaptability | Static; fixed parameters | Dynamic; simulates periodic re-optimization |
| Parameter Stability | Not measured | Monitored across windows |
| Realism | Low; assumes fixed parameters | High; mimics real-world trading constraints |
| Computational Cost | Low; simple and fast | High; requires repeated optimizations |
| Primary Output | Single equity curve | Composite equity curve |
Walk Forward Analysis does demand significantly more computational resources, as it involves repeated optimization cycles for each window. But this extra effort pays off with more reliable results. While a single out-of-sample test might only reflect performance under specific market conditions, Walk Forward Analysis evaluates strategies across a variety of market environments - trending, ranging, or volatile. This approach ensures that any observed edge is both robust and consistent over time.
Advantages and Disadvantages of Each Method
Every method comes with its own set of trade-offs that can shape your strategy development process.
Out-of-Sample Testing stands out for its ease of use. With a simple 70/30 data split, it allows you to test years' worth of data in just minutes, making it ideal for quick, preliminary evaluations. This method works particularly well for straightforward, rule-based systems with only one or two parameters, as it provides fast feedback without requiring heavy computational resources. However, its reliance on a single data split introduces a risk of "lucky" partitioning - where the chosen split might inadvertently favor your strategy due to chance. Because of this, it’s less reliable for complex systems with numerous parameters, which are more susceptible to curve-fitting.
Walk Forward Analysis (WFA) takes a more robust approach. By using rolling windows to perform multiple train-and-test cycles, it generates a distribution of performance results rather than a single metric. This process mimics the periodic re-optimization seen in real-world trading, helping to identify whether your strategy can adapt to changing market conditions or if it’s simply overfitting historical data. The downside? WFA demands significant computational power and involves a more intricate setup.
Comparison Table: Pros and Cons
| Method | Primary Advantages | Primary Disadvantages | Best Use Case |
|---|---|---|---|
| Out-of-Sample Testing | Simple to set up, fast to execute, and effective with limited data. | Prone to lucky splits and overfitting. | Quick evaluations for simple, rule-based systems. |
| Walk Forward Analysis | Simulates real-world re-optimization and detects parameter drift. | Computationally intensive and complex to set up. | Comprehensive validation for parameter-heavy strategies. |
This comparison highlights how each method aligns with different trading needs.
When to Use Each Method
Choosing the right validation method depends on the complexity of your strategy and the data you have available.
Start with out-of-sample testing if you’re looking to quickly weed out underperforming strategies or if your system is built on stable, fundamental principles. This method is especially helpful when working with a smaller historical dataset.
For more thorough validation - especially for automated or frequently re-optimized strategies - turn to Walk Forward Analysis. If your strategy involves three or more adjustable parameters (like RSI periods, ATR multipliers, or moving average lengths), WFA is crucial to ensure your parameters reflect genuine market patterns rather than just historical quirks. For the most reliable results, consider a layered approach: begin with traditional backtesting to eliminate obvious failures, use WFA for in-depth validation, and reserve a final 10–20% of your data as a hold-out sample for blind testing. This final step helps confirm real-world performance and reduces the risk of overfitting.
Using Traidies for Strategy Validation in MQL5

Walk Forward Analysis and Out-of-Sample Testing are great tools for reducing optimization bias, but Traidies takes these methods up a notch by automating the entire process.
Automated Backtesting with Traidies
Traidies simplifies backtesting by removing the need for manual effort. With its AI Strategy Parser, you can describe your trading strategy in plain English, and the platform will automatically generate MQL5 code. This means you don’t need any programming skills to get started. Plus, the Built-in Strategy Tester allows you to backtest strategies using historical price data for currencies and stocks. It even supports multi-currency testing, which is perfect for strategies that depend on correlation patterns.
For out-of-sample testing, Traidies takes care of splitting your historical data into optimization and validation segments. This ensures your strategy is tested on unseen data, giving you a clearer picture of its performance. The platform also automates Walk Forward Analysis by using rolling windows, so you don’t have to manually re-run optimizations over different time periods - a task many traders find frustrating and time-consuming.
Improving Strategy Validation Efficiency
Traidies doesn’t stop at backtesting; it also streamlines the validation process. By automating the separation of training and testing data, it eliminates the risk of data snooping bias - where traders accidentally use test data during optimization. This is a common issue in manual workflows.
The platform saves time and boosts accuracy by managing the heavy computational work involved in running multiple rolling windows for Walk Forward Analysis. Each optimization cycle is handled with precision, ensuring the results meet strict standards. This process produces a distribution of performance metrics that mirrors how your strategy might behave in actual market conditions, where periodic re-optimization is often required. Thanks to these automated features, Traidies makes strategy validation in MQL5 more reliable and efficient.
Conclusion
Out-of-Sample Testing and Walk Forward Analysis work hand in hand to refine trading strategies. OOS testing acts as a safeguard, splitting data into training and testing sets to catch curve-fitting early on. Meanwhile, Walk Forward Analysis mimics real-world conditions by periodically re-optimizing strategies across shifting market environments. As Robert Pardo, author of The Evaluation and Optimization of Trading Strategies, aptly puts it:
"A strategy that hasn't been walk-forward tested is a hypothesis. A strategy that has been walk-forward tested and passed is an investment thesis. There's a world of difference".
The best results come from combining these methods into a structured workflow. Start with basic backtesting to weed out flawed concepts, move on to Walk Forward Analysis to evaluate parameter stability, and conclude with a final hold-out sample for confirmation. This process not only reduces the risk of overfitting but also lays the groundwork for automation to enhance validation.
Walk-Forward Efficiency (WFE) plays a critical role in this process. A WFE above 70% indicates a strong strategy, while anything below 30% suggests overfitting. It’s also crucial to look for parameter plateaus rather than isolated peaks, as stable clusters of optimal values tend to perform better across varying market conditions.
Given how demanding manual validation can be - both in terms of computational effort and the risk of human error, like accidentally "peeking" at test data - automation becomes essential. Tools like Traidies streamline this process by splitting historical data, running rolling window optimizations, and calculating WFE metrics. This ensures that your MQL5 strategies meet professional standards before risking real capital.
FAQs
How do I choose the best in-sample vs out-of-sample split?
When deciding on the right split, it’s all about aligning with your strategy’s objectives and the market environment. Typically, you’ll allocate 70-80% of your data as in-sample for optimization purposes. This helps fine-tune your approach, but be careful not to overfit - it’s a common pitfall. The remaining 20-30% serves as out-of-sample data, which is essential for testing how well your strategy holds up in unseen scenarios.
For markets that are constantly shifting, walk-forward analysis is a solid option. This method cycles through in-sample and out-of-sample data over time, allowing you to evaluate your strategy’s performance under different conditions. It’s a practical way to adapt and minimize the chances of overfitting in a dynamic market landscape.
How many walk-forward windows do I need for reliable results?
The number of walk-forward windows you'll need varies based on your strategy, the data you're working with, and the specific market conditions. A common approach is to use 6 to 12 overlapping windows to evaluate performance across various market environments.
Smaller windows allow for more frequent testing but might not have enough data to provide meaningful insights. On the other hand, larger windows offer more data per test but could overlook shifts in market conditions. Striking the right balance between window size and the number of tests is key to achieving results you can trust.
What’s a “good” Walk-Forward Efficiency (WFE) score for a strategy?
A Walk-Forward Efficiency (WFE) score above 50% is generally considered "good." This means the strategy manages to maintain at least half of its in-sample performance when applied out-of-sample. Scores exceeding 70% suggest strong parameter stability and reliability. These benchmarks are useful for evaluating how effectively a strategy performs outside its optimization phase.